Unlock a world of possibilities! Login now and discover the exclusive benefits awaiting you.
- Qlik Community
- :
- Forums
- :
- Analytics
- :
- New to Qlik Analytics
- :
- Re: How to take average reference line by year
- Subscribe to RSS Feed
- Mark Topic as New
- Mark Topic as Read
- Float this Topic for Current User
- Bookmark
- Subscribe
- Mute
- Printer Friendly Page
- Mark as New
- Bookmark
- Subscribe
- Mute
- Subscribe to RSS Feed
- Permalink
- Report Inappropriate Content
How to take average reference line by year
Hi Everyone,
Since I am new to Qliksense, I have one doubt, below is my scenario.
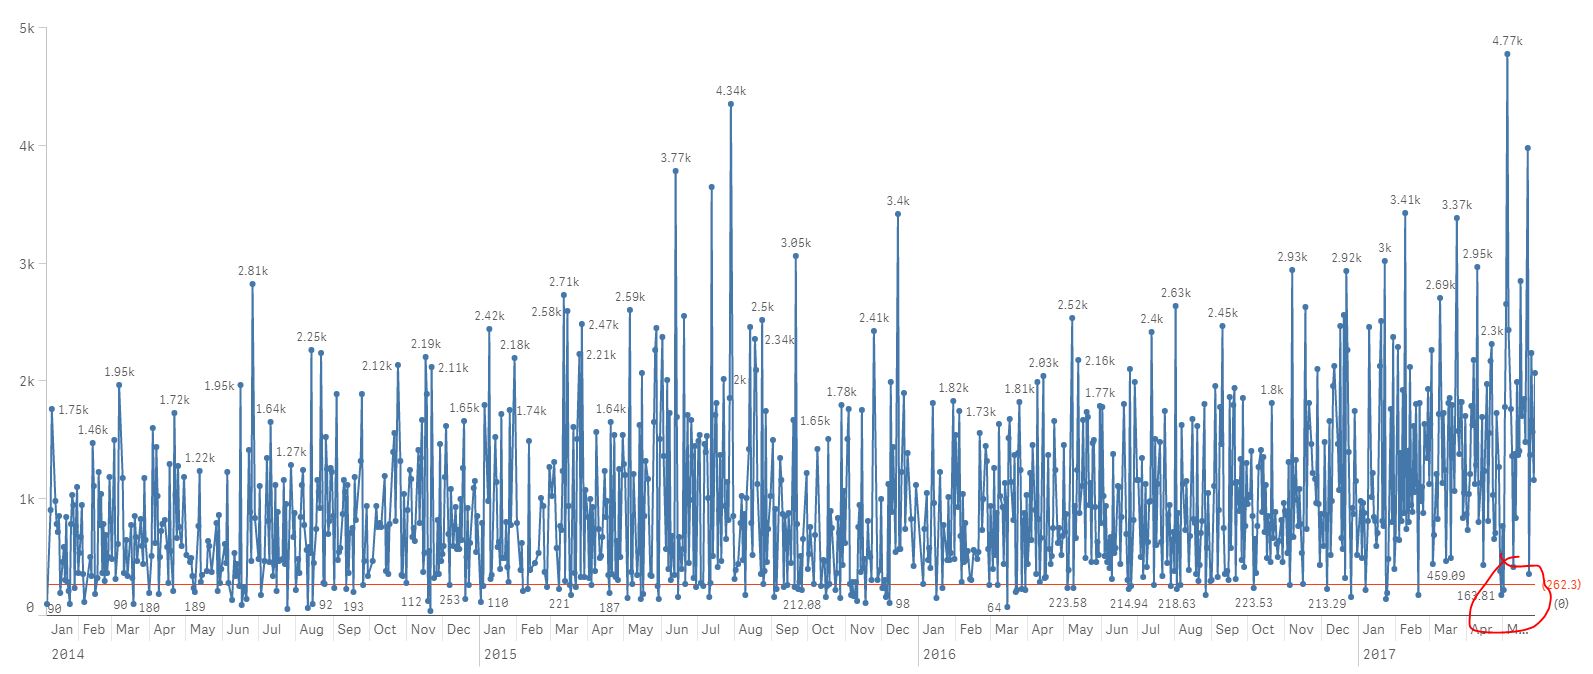
I have a line chart with multiple years data and i want to display reference line for 2014 year only by average but when i have write a formula the line is showing for all years, as per my condition it should show till 2014 Dec, here i am attaching my screen shot. please help me on this topic.
Thanks,
Modipalli
- Mark as New
- Bookmark
- Subscribe
- Mute
- Subscribe to RSS Feed
- Permalink
- Report Inappropriate Content
i guess you can't.
- Mark as New
- Bookmark
- Subscribe
- Mute
- Subscribe to RSS Feed
- Permalink
- Report Inappropriate Content
May be use set analysis or if statement to restrict your line to Dec 2014.... If you can share a sample, we might be able to help you better here
- Mark as New
- Bookmark
- Subscribe
- Mute
- Subscribe to RSS Feed
- Permalink
- Report Inappropriate Content
Hi Sunny,
Please find the attached sample file and let me know if possible.
Note: need to display through reference line only
Formula : Avg(Revenue) for 2014 - Reference line
but graph need to display 2014,2015 and 2016 data
- Mark as New
- Bookmark
- Subscribe
- Mute
- Subscribe to RSS Feed
- Permalink
- Report Inappropriate Content
I was hoping for you to attach your qvf file or load the above data into qvf and create the chart for me. Because I am new to QlikSense, I am not sure how to recreate the chart you have in your dashboard.