Unlock a world of possibilities! Login now and discover the exclusive benefits awaiting you.
- Qlik Community
- :
- Forums
- :
- Analytics
- :
- New to Qlik Analytics
- :
- Re: How to track feedback for the below data?
- Subscribe to RSS Feed
- Mark Topic as New
- Mark Topic as Read
- Float this Topic for Current User
- Bookmark
- Subscribe
- Mute
- Printer Friendly Page
- Mark as New
- Bookmark
- Subscribe
- Mute
- Subscribe to RSS Feed
- Permalink
- Report Inappropriate Content
How to track feedback for the below data?
Hi All,
I'm struggling to figure out for the solution for the below problem, this is the data below that I do have :
Table 1
Question_no,Question
1,How did you like the website?
2,How far you recommend this to your friends?
Table 2
Response_Code,Question_no
3,1
4,1
1,1
5,2
4,2
Table 3
Response_Code, Response_Code_Desc
1, Extrem Dissatisfied
2,Dissatisfied
3,Neutral
4,Satisfied
5,Full Satisfied
. , .
. , .
. , .
This table also have many other non related codes
Now I need a chart for each question lets say 10 students rated 2 ,20 students rated 3 ,30 students rated 4 (Scale of 1-5 is used) for question 1?
Any idea on this .. I'm new to Qlik view?
Accepted Solutions
- Mark as New
- Bookmark
- Subscribe
- Mute
- Subscribe to RSS Feed
- Permalink
- Report Inappropriate Content
Hi Dinesh,
I believe you can have a stacked chart with the counts of each response code for each question as shown below;
Create Bar Chart
Dimension = Question Number
Dimension = Response Code Desc
Measure = Count(Response_Code)
Attached is a sample QS qvf.
Hope this helps !
- Mark as New
- Bookmark
- Subscribe
- Mute
- Subscribe to RSS Feed
- Permalink
- Report Inappropriate Content
If you just load your three tables in the script using the wizard, you should have three tables in your data model linked by Question_no and Response_Code.
I would suggest adding an ID field to the fact table containing Response_Code and Question_no:
LOAD
Recno() as ID,
Response_Code,
Question_ no
FROM ...;
Then create a chart with two dimensions, Question_no and Response_Code (or the respective description fields) and a single expression
=Count(ID)
- Mark as New
- Bookmark
- Subscribe
- Mute
- Subscribe to RSS Feed
- Permalink
- Report Inappropriate Content
Hi Dinesh,
I believe you can have a stacked chart with the counts of each response code for each question as shown below;
Create Bar Chart
Dimension = Question Number
Dimension = Response Code Desc
Measure = Count(Response_Code)
Attached is a sample QS qvf.
Hope this helps !
- Mark as New
- Bookmark
- Subscribe
- Mute
- Subscribe to RSS Feed
- Permalink
- Report Inappropriate Content
Thank you for your sample qvf. It worked well .
- Mark as New
- Bookmark
- Subscribe
- Mute
- Subscribe to RSS Feed
- Permalink
- Report Inappropriate Content
Hi Ugonna, I have one more question I'm struggling with :
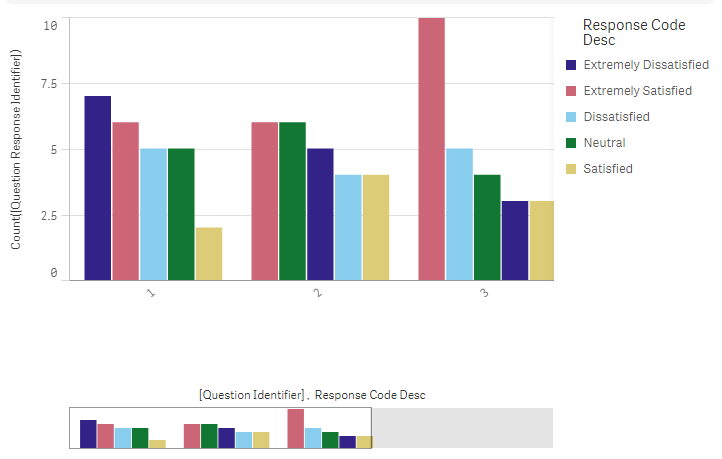
I have done the chart in the same way but not in the stacked chart which looks like in the screenshot attached, Now Im trying to restrict the data just to Question number =1 , which I'm trying to put in [Question_number]=1 in field box also tried limitations box , which is not giving me the desired o/p.
PFA
I just need one set of the values just for one question unlike the thing in the screenshot .
Thanks in advance !!
- Mark as New
- Bookmark
- Subscribe
- Mute
- Subscribe to RSS Feed
- Permalink
- Report Inappropriate Content
Try a set expression to limit your record set to the single question
=Count({<Question_no = {1}>} Response_Code)
as expression.
[as a side note, you shouldn't count a key field, so if Response_Code is a key field linking two tables, chose another appropriate field (that's why I suggested to create the ID field)]
- Mark as New
- Bookmark
- Subscribe
- Mute
- Subscribe to RSS Feed
- Permalink
- Report Inappropriate Content
Hi Dinesh,
Following Swuehl's approach should give you the desired results.
Here's a link about set analysis you might find helpful A Primer on Set Analysis
- Mark as New
- Bookmark
- Subscribe
- Mute
- Subscribe to RSS Feed
- Permalink
- Report Inappropriate Content
Thank you Swuehl and Ugonna , it worked perfect !!
- Mark as New
- Bookmark
- Subscribe
- Mute
- Subscribe to RSS Feed
- Permalink
- Report Inappropriate Content
I do have 2 columns in table1 as below:
Employee_ID,Meeting_x,Meeting_y
101,0,1
111,1,2
121,3.3
table2:
Meeting_Identifier,Meeting_Desc
0,Not Met
1,Met Once
2,Met Twice
3,Met Thrice
so I need two different charts on statistics of Meetingx and Meetingy lets say 2 ppl Not Met ,3 ppl Met Thrice !!
I'm able to do it with a join on these two tables (Meeting_x & Meeting_Identifier) but I need join to happen on multiple columns from table 1 which also includes Meeting_y.
Any help on this ?
and the desired o/p would be :
on X axis : Not Met, Met Once, Met thrice
on Y axis : Count of ppl.
I have done this doing the join on Meeting X and Meeting Identifier but how about Meeting Y?
Thanks in advance !!
- Mark as New
- Bookmark
- Subscribe
- Mute
- Subscribe to RSS Feed
- Permalink
- Report Inappropriate Content
Maybe you can transform your cross table into a straight table:
CROSSTABLE( Meeting, Meeting_Identifier)
LOAD Employee_ID, Meeting_x, Meeting_y
FROM ...;
Now you should be able to use Meeting_Desc as dimension in your chart and then use
=Count( Employee_ID)
as expression.