Unlock a world of possibilities! Login now and discover the exclusive benefits awaiting you.
- Qlik Community
- :
- Forums
- :
- Analytics
- :
- New to Qlik Analytics
- :
- Re: Ignore 0 value in line chart
- Subscribe to RSS Feed
- Mark Topic as New
- Mark Topic as Read
- Float this Topic for Current User
- Bookmark
- Subscribe
- Mute
- Printer Friendly Page
- Mark as New
- Bookmark
- Subscribe
- Mute
- Subscribe to RSS Feed
- Permalink
- Report Inappropriate Content
Ignore 0 value in line chart
Sorry if this is a dumb question. I am new to Qlik Sense and struggling a bit to solve what i expect is a simple problem. i have a line chart with several measures. the chart should show data points over time. some weeks will not have data yet. i want the line to stop. instead, the application plots the data as 0. see below:
the highest line goes from 30 in -w8 to 0 in -w7. I would like the line to just stop at 30.
thanks.

Accepted Solutions
- Mark as New
- Bookmark
- Subscribe
- Mute
- Subscribe to RSS Feed
- Permalink
- Report Inappropriate Content
Hi Greg,
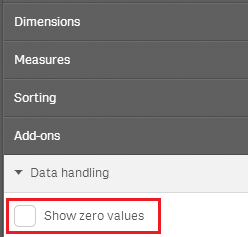
In the properties panel click the Add-ons section and then click Data handling to see the options - at the moment there is just one option labelled Show zero values which you need to un-tick.
Simon
- Mark as New
- Bookmark
- Subscribe
- Mute
- Subscribe to RSS Feed
- Permalink
- Report Inappropriate Content
Select Chart Right Click and Set Min and Max scale
Vikas
If the issue is solved please mark the answer with Accept as Solution & like it.
If you want to go quickly, go alone. If you want to go far, go together.
- Mark as New
- Bookmark
- Subscribe
- Mute
- Subscribe to RSS Feed
- Permalink
- Report Inappropriate Content
actually want to ignore null value instead of treating as 0
- Mark as New
- Bookmark
- Subscribe
- Mute
- Subscribe to RSS Feed
- Permalink
- Report Inappropriate Content
hey vikas-
thanks for the response. your example looks like qlikview. but i did try to change the min/max in qlik sense and it didnt impact the chart.
thx though.
- Mark as New
- Bookmark
- Subscribe
- Mute
- Subscribe to RSS Feed
- Permalink
- Report Inappropriate Content
If you go to the "Dimension" property on the right, and look at the "Limitation" drop down.
Select "Exact Value"
Then ">"
and 0.
Untick "Show others" and it will then only display values > 0.
- Mark as New
- Bookmark
- Subscribe
- Mute
- Subscribe to RSS Feed
- Permalink
- Report Inappropriate Content
Hi Greg,
In the properties panel click the Add-ons section and then click Data handling to see the options - at the moment there is just one option labelled Show zero values which you need to un-tick.
Simon
- Mark as New
- Bookmark
- Subscribe
- Mute
- Subscribe to RSS Feed
- Permalink
- Report Inappropriate Content
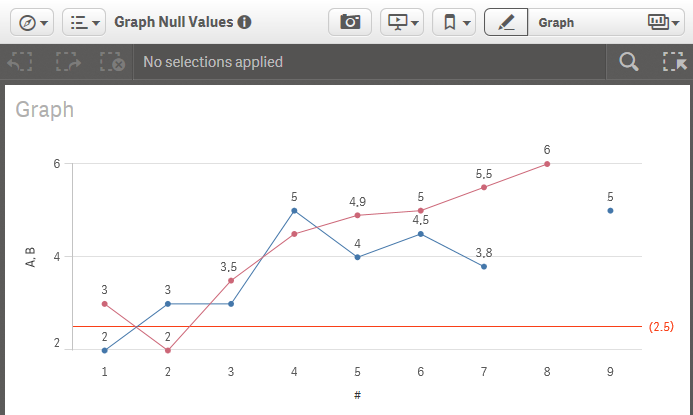
Yes there is at least a couple of ways of achieving this - I have attached a Qlik Sense app that illustrates the two approaches. Which one you use depends on how you do your dimension and measure choices...
- Mark as New
- Bookmark
- Subscribe
- Mute
- Subscribe to RSS Feed
- Permalink
- Report Inappropriate Content
@petter Thank you for the very simple solution. The if(sum...null()) works very well.
- Mark as New
- Bookmark
- Subscribe
- Mute
- Subscribe to RSS Feed
- Permalink
- Report Inappropriate Content
@petter, Could you please post the screenshot of the expression which you used to achieve this