Unlock a world of possibilities! Login now and discover the exclusive benefits awaiting you.
- Qlik Community
- :
- Forums
- :
- Analytics
- :
- New to Qlik Analytics
- :
- Ignore Selection Filter DAY
- Subscribe to RSS Feed
- Mark Topic as New
- Mark Topic as Read
- Float this Topic for Current User
- Bookmark
- Subscribe
- Mute
- Printer Friendly Page
- Mark as New
- Bookmark
- Subscribe
- Mute
- Subscribe to RSS Feed
- Permalink
- Report Inappropriate Content
Ignore Selection Filter DAY
good morning
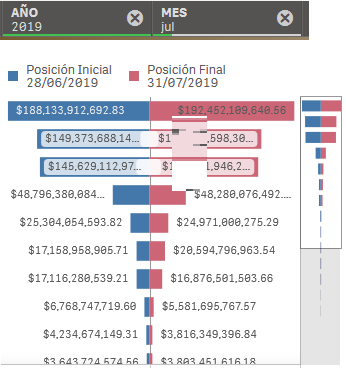
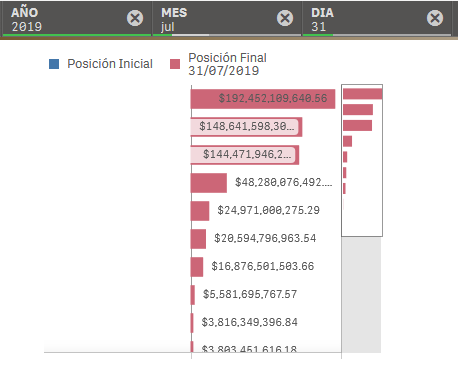
I need help! I am making a bar graph where I show the sales of the previous month vs current month, when I filter by Year or Month it shows me the sales of a previous month. But the problem I have is that when I select the day, my graph does not show me the sales of the previous month, only the current sales and the day I filter. Then they ask me that when I filter the day that the sales of the previous month are still showing, the sales of the previous month are for the last day of the month just like the current one. I am applying the following formula:
(SUM ({$ <CLOSURE_ MONTH = {1}, DATE = {"$ (= Max ({<MONTH = {'$ (= Month (AddMonths (Max (DATE), - 1))))'}, YEAR = { '$ (= Year (AddMonths (Max (DATE), - 1)))'}>} DATE)) "}, MONTH =, DAY =>} SALES))
* (-1)
So in the formula I am saying that I ignore the selections of the DIA field, I do not know that I need to add in the set and analysis or do something else so that I can perform that visualization or it cannot be done.
I add some images of how the graph is and when I select the day as shown.
I hope you can help me, since I don't know how to do it
Thank you so much
- Mark as New
- Bookmark
- Subscribe
- Mute
- Subscribe to RSS Feed
- Permalink
- Report Inappropriate Content
Have you tried to remove the '$' identifier in the beginning of the set analysis? It associate your selection with the set analysis.
- Mark as New
- Bookmark
- Subscribe
- Mute
- Subscribe to RSS Feed
- Permalink
- Report Inappropriate Content
Thank you very much for your time Alloren_14
if I already remove the $, but it still does not show me the bars of the previous month when selecting the day. I don't know how another way can be done