Unlock a world of possibilities! Login now and discover the exclusive benefits awaiting you.
- Qlik Community
- :
- Forums
- :
- Analytics
- :
- New to Qlik Analytics
- :
- Re: Importing of txt files
- Subscribe to RSS Feed
- Mark Topic as New
- Mark Topic as Read
- Float this Topic for Current User
- Bookmark
- Subscribe
- Mute
- Printer Friendly Page
- Mark as New
- Bookmark
- Subscribe
- Mute
- Subscribe to RSS Feed
- Permalink
- Report Inappropriate Content
Importing of txt files
Hello, I am new to qliksense and trying to learn it. I have a dataset (txt file), have imported it yet. And when I open the datamanager its showed like a table, but the problem is in the visualization of the data. As dimension it shows the dates that right but when I try to add KPI there is only the range from -1 to 1. But there are huge numbers in the txt file, I think qliksense doesn't recognise these numbers. Thanks in advance.


- « Previous Replies
-
- 1
- 2
- Next Replies »
Accepted Solutions
- Mark as New
- Bookmark
- Subscribe
- Mute
- Subscribe to RSS Feed
- Permalink
- Report Inappropriate Content
That works fine for me. I think you might have to post your whole app?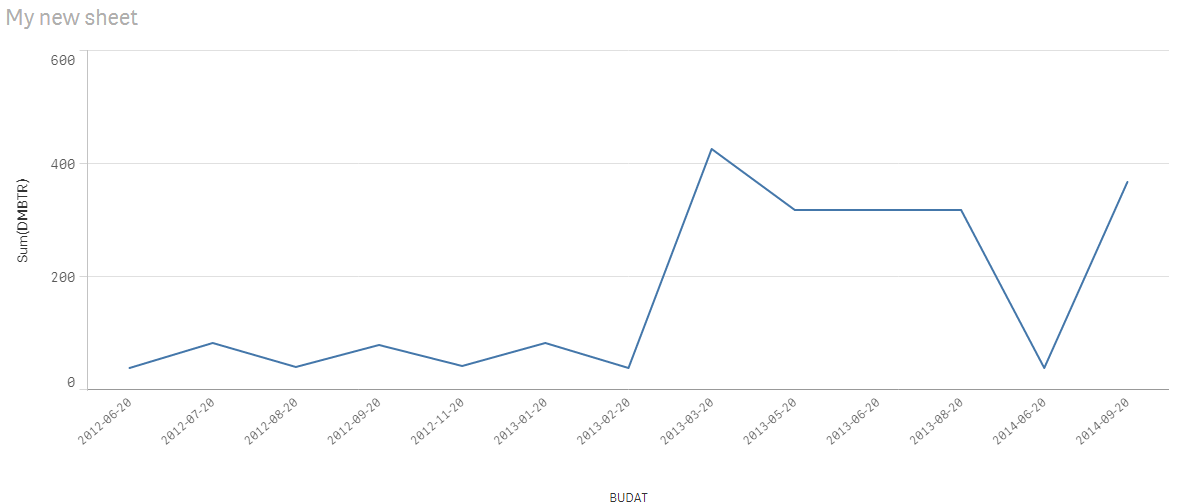
- Mark as New
- Bookmark
- Subscribe
- Mute
- Subscribe to RSS Feed
- Permalink
- Report Inappropriate Content
Could you post the text file or the app itself?
It looks like you have one big field.
Try to use '|' as delimiter in "Trennzeichen"
- Mark as New
- Bookmark
- Subscribe
- Mute
- Subscribe to RSS Feed
- Permalink
- Report Inappropriate Content
If you're seeing the 'correct' data (separated into different fields) in DataManager, then it's already picking up the correct delimiter (Trennzeichen).
The issue is then possible that it is seeing the numbers as text.
- Turn on "show data points" in your chart. You will see clearly if the datapoints are being shown as 'zero' or are missing completely
- Are there any text-values in *any* of your data in DMBTR? One NULL or text value will prevent it from showing the other numbers as numbers.
- Make sure you check the footers of the file as well
- It might be easier to edit the input file, or stick it into Excel and save as "tab-delimited" after you've cleaned it up
- If you don't want to clean up the data in Excel, use the following two commands at the top of your load script;
- NullAsValue *;
- Set NullDisplay = 0; //the semicolons are important
- This will tell the load script to replace all athe NULLs with zeroes (this may or may not be desirable and will affect your COUNTs, etc.
- If there are no strange values in your source data and Qlik still thinks the data is text, then edit the load script;
- Check your LOAD script and change;
- DMBTR, to
- NUM(DMBTR) as DMBTR, //(don't forget the comma!)
- Check your LOAD script and change;
Feel free to ask any further questions, or mark the answer as helpful, or correct (if it is!)
- Mark as New
- Bookmark
- Subscribe
- Mute
- Subscribe to RSS Feed
- Permalink
- Report Inappropriate Content
Hello, the txt file Looks like this

the names of the columns are listed in the first line, the next lines are the Content.
The Load looks like this:
[BSAD]:
LOAD*
FROM [lib://....../BSAD.txt]
(txt, codepage is 1252, embedded labels, delimiter is '|', msq);
- Mark as New
- Bookmark
- Subscribe
- Mute
- Subscribe to RSS Feed
- Permalink
- Report Inappropriate Content
Thank you very much but the column contains only monetary numbers in thousand steps, ist an imported txt file,
is it still possible to rewrite the variables in the Skript of Qliksense? My load source looks like following:
[BSAD]:
LOAD*
FROM [lib://....../BSAD.txt]
(txt, codepage is 1252, embedded labels, delimiter is '|', msq);
- Mark as New
- Bookmark
- Subscribe
- Mute
- Subscribe to RSS Feed
- Permalink
- Report Inappropriate Content
Are you able to post the whole .txt file? (Compress it in a .zip file if possible/necessary)?
(Also, I just noticed your dates aren't showing as dates - they are just labels for the axis. That's a separate issue but perhaps we can work on that at the same time?
- Mark as New
- Bookmark
- Subscribe
- Mute
- Subscribe to RSS Feed
- Permalink
- Report Inappropriate Content
I think the problem is with your measure. You appear to be getting True/False values. Can you post your measure expression please?
-Rob
- Mark as New
- Bookmark
- Subscribe
- Mute
- Subscribe to RSS Feed
- Permalink
- Report Inappropriate Content
Unfortunately I am not able to send the whole txt file, here is a part of the text file. It Looks completely the same.
MANDT|BUKRS|KUNNR|UMSKS|UMSKZ|AUGDT|AUGBL|ZUONR|GJAHR|BELNR|BUZEI|BUDAT|BLDAT|DMBTR|WRBTR|WAERS
150|UN01|0038205483|||2012-12-07|0002398239|200000000002398239|2012|1002398239|1|2012-11-20|2012-11-20|40.42500|40.42500|EUR
150|UN01|0038205486|||2013-04-24|0003118208|200000000003118208|2013|1003118208|1|2013-03-20|2013-03-21|316.59830|316.59830|EUR
150|UN01|0038205486|||2013-07-14|0003438234|200000000003438234|2013|1003438234|1|2013-05-20|2013-05-20|317.30680|317.30680|EUR
150|UN01|0038205486|||2013-07-08|0003798368|200000000003798368|2013|1003798368|1|2013-06-20|2013-06-23|317.02340|317.02340|EUR
150|UN01|0038205486|||2013-10-25|0004118379|200000000004118379|2013|1004118379|1|2013-08-20|2013-08-23|316.88170|316.88170|EUR
150|UN01|0038205486|||2014-09-23|0006601142|200000000006601142|2014|1006601142|1|2014-09-20|2014-09-22|323.96670|323.96670|EUR
150|UN01|0038205491|||2012-09-19|0001561150|200000000001561150|2012|1001561150|1|2012-07-20|2012-07-21|42.12540|42.12540|EUR
150|UN01|0038205491|||2013-05-10|0003001169|200000000003001169|2013|1003001169|1|2013-03-20|2013-03-22|32.63150|32.63150|EUR
150|UN01|0038205491|||2014-08-10|0006001104|200000000006001104|2014|1006001104|1|2014-06-20|2014-06-19|37.73270|37.73270|EUR
150|UN01|0038204042|||2012-08-06|0001241040|200000000001241040|2012|1001241040|1|2012-06-20|2012-06-17|37.30760|37.30760|EUR
150|UN01|0038204042|||2012-08-24|0001678423|200000000001678423|2012|1001678423|1|2012-08-20|2012-08-20|40.14160|40.14160|EUR
150|UN01|0038204042|||2012-09-28|0001841408|200000000001841408|2012|1001841408|1|2012-09-20|2012-09-18|36.31570|36.31570|EUR
150|UN01|0038204042|||2013-03-05|0002748122|200000000002748122|2013|1002748122|1|2013-01-20|2013-01-20|41.55860|41.55860|EUR
150|UN01|0038204042|||2013-05-02|0003120925|200000000003120925|2013|1003120925|1|2013-03-20|2013-03-17|36.17400|36.17400|EUR
150|UN01|0038204042|||2014-11-02|0006681371|200000000006681371|2014|1006681371|1|2014-09-20|2014-09-20|41.84200|41.84200|EUR
150|UN01|0038204052|||2012-10-04|0001480840|200000000001480840|2012|1001480840|1|2012-07-20|2012-07-19|39.57480|39.57480|EUR
150|UN01|0038204052|||2012-10-30|0001838661|200000000001838661|2012|1001838661|1|2012-09-20|2012-09-18|41.13350|41.13350|EUR
150|UN01|0038204053|||2013-03-27|0002797904|200000000002797904|2013|1002797904|1|2013-01-20|2013-01-19|39.43310|39.43310|EUR
150|UN01|0038204053|||2013-04-21|0002878127|200000000002878127|2013|1002878127|1|2013-02-20|2013-02-21|38.44120|38.44120|EUR
150|UN01|0038204053|||2013-04-28|0003081251|200000000003081251|2013|1003081251|1|2013-03-20|2013-03-20|39.00800|39.00800|EUR
- Mark as New
- Bookmark
- Subscribe
- Mute
- Subscribe to RSS Feed
- Permalink
- Report Inappropriate Content
Good point. You probably want that measure to be Sum(DMBTR) - instead of just DMBTR.
(I don't think you're seeing True/False - the scaling from -1 to 1 is just the default scaling for an all-zero chart. That's why I suggested adding markers for the data points; it will give us an idea of what's happening).
(I'm speaking from experience! I started off in the same place - trying to get charts to show correctly with incorrect all-zero data).
- Mark as New
- Bookmark
- Subscribe
- Mute
- Subscribe to RSS Feed
- Permalink
- Report Inappropriate Content
Hello thanks,
but I don't have a measure I am still a beginner and wanted to simulate a simple data visualisation.
For measurement I think I Need more time. I just added as Dimension the date and as KPI DMBTR
- « Previous Replies
-
- 1
- 2
- Next Replies »