Unlock a world of possibilities! Login now and discover the exclusive benefits awaiting you.
- Qlik Community
- :
- Forums
- :
- Analytics
- :
- New to Qlik Analytics
- :
- Re: In filter Value selection draw a line in line ...
- Subscribe to RSS Feed
- Mark Topic as New
- Mark Topic as Read
- Float this Topic for Current User
- Bookmark
- Subscribe
- Mute
- Printer Friendly Page
- Mark as New
- Bookmark
- Subscribe
- Mute
- Subscribe to RSS Feed
- Permalink
- Report Inappropriate Content
In filter Value selection draw a line in line chart
Hi Friends,
For example I have one filter , that filter having five values.. When i select one value i need to draw one line in chart and i select one more value in the same filter i need to display two lines for the current selection, like that i need to display 5 values for 5 lines in a line chart.
Is it possible??
Please help on this.
Thanks in Advance,
Jana
- Mark as New
- Bookmark
- Subscribe
- Mute
- Subscribe to RSS Feed
- Permalink
- Report Inappropriate Content
Yes, use the field in which you make selections as dimension in your line chart. The line chart will draw one line for each selected value or for all values if no selection is made.
talk is cheap, supply exceeds demand
- Mark as New
- Bookmark
- Subscribe
- Mute
- Subscribe to RSS Feed
- Permalink
- Report Inappropriate Content
Hi Gysbert,
Actually i was using another dimension.
Can u give me some example qvf file
Thanks for replying
- Mark as New
- Bookmark
- Subscribe
- Mute
- Subscribe to RSS Feed
- Permalink
- Report Inappropriate Content
Use the field in which you select values as the second dimension. The first dimension will be used for the x-axis values. The second dimension to create the different lines.
talk is cheap, supply exceeds demand
- Mark as New
- Bookmark
- Subscribe
- Mute
- Subscribe to RSS Feed
- Permalink
- Report Inappropriate Content
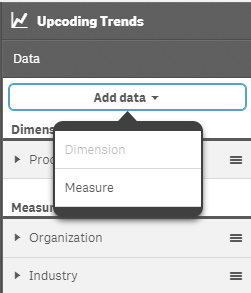
As per my knowledge we can use only one dimension for line chart.
I'm not able to add one more dimension
- Mark as New
- Bookmark
- Subscribe
- Mute
- Subscribe to RSS Feed
- Permalink
- Report Inappropriate Content
Hi janardhan,
i would use qsVariable (which you can find here) so you set 1 variable for each Measure u use, set it as button and give 2 alternatives. 1st alternative is 0 and called off the other one is called on and has the value 1.
Now you simply put the variable via $(Variablename) multiplied behind your measure.
I added a .qvf for further examples. BUT you need qsVariable Extension to make it work
Regards
Chris
EDIT: If you set the off alternative to "null()" the line will fully disappear, if you leave it as 0 (number zero) it will be place on the x-axis. Haven't edited this in the Test.qvf file i added.
- Mark as New
- Bookmark
- Subscribe
- Mute
- Subscribe to RSS Feed
- Permalink
- Report Inappropriate Content
That's because you have more than one measure. A line chart can indeed not show multiple measures over multiple dimensions.
talk is cheap, supply exceeds demand
- Mark as New
- Bookmark
- Subscribe
- Mute
- Subscribe to RSS Feed
- Permalink
- Report Inappropriate Content
Yes , i need to use more than one measure.