Unlock a world of possibilities! Login now and discover the exclusive benefits awaiting you.
- Qlik Community
- :
- Forums
- :
- Analytics
- :
- New to Qlik Analytics
- :
- Inverse Selection in Pie Chart
- Subscribe to RSS Feed
- Mark Topic as New
- Mark Topic as Read
- Float this Topic for Current User
- Bookmark
- Subscribe
- Mute
- Printer Friendly Page
- Mark as New
- Bookmark
- Subscribe
- Mute
- Subscribe to RSS Feed
- Permalink
- Report Inappropriate Content
Inverse Selection in Pie Chart
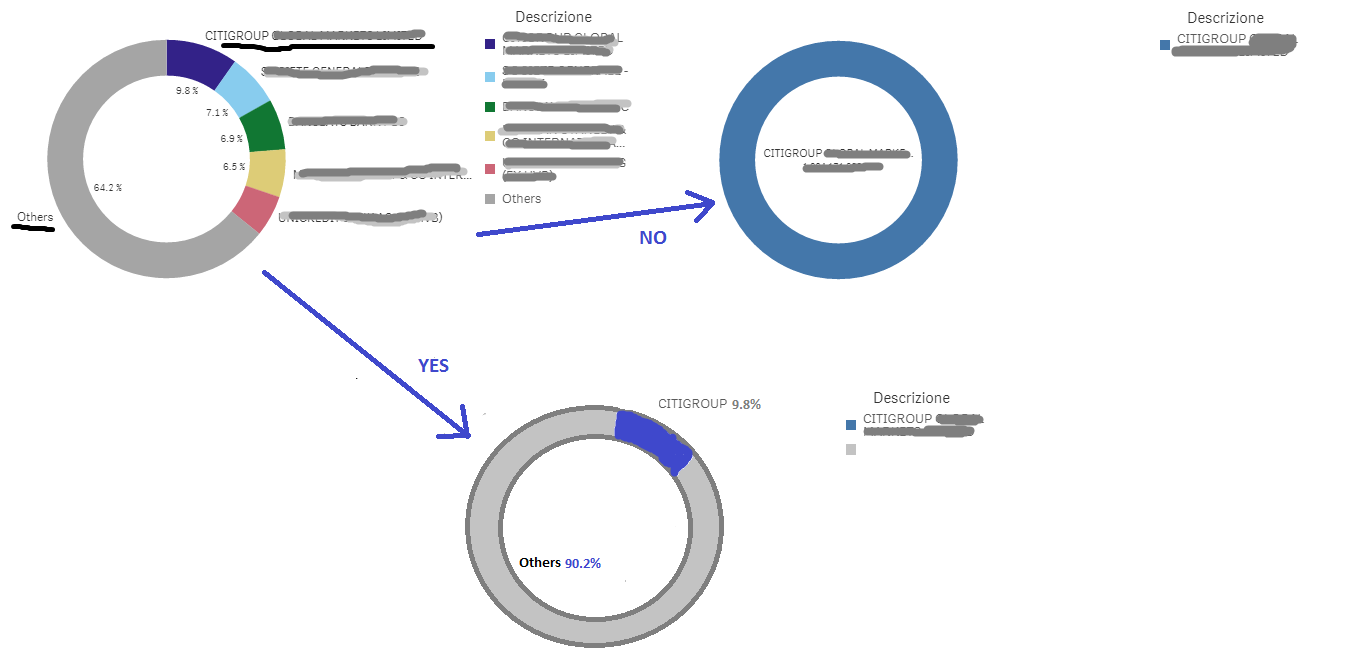
Hi all, I'd like to compare the value of a selected field with the inverse selection ('others').
I tried with Set Analysis but I need your help.
I'd like to reach this result that I have shown in the following picture.
- Mark as New
- Bookmark
- Subscribe
- Mute
- Subscribe to RSS Feed
- Permalink
- Report Inappropriate Content
May be use dimension limits to show the top 1 and check 'Show Others' to put everything else in a other bucket
- Mark as New
- Bookmark
- Subscribe
- Mute
- Subscribe to RSS Feed
- Permalink
- Report Inappropriate Content
The problem is that at first I want the top five visualization and only when i decide to click to one particular item the pie graph ust change in the version with the clicked item and all the other possibilities as others.
The problem is that by default Qlik sense qhen somebody clik one row use only the selected part of data and not the others.
I need a "dinamic" change if it's possible.
- Mark as New
- Bookmark
- Subscribe
- Mute
- Subscribe to RSS Feed
- Permalink
- Report Inappropriate Content
Can you may be share your qvf file? It is difficult to understand what you are trying to do just by reading what you have shared above?