Unlock a world of possibilities! Login now and discover the exclusive benefits awaiting you.
Announcements
Accelerate Your Success: Fuel your data and AI journey with the right services, delivered by our experts.
Learn More
- Qlik Community
- :
- Forums
- :
- Analytics
- :
- New to Qlik Analytics
- :
- Re: Is it a bug in Qlik Sense 3.0 ?
Options
- Subscribe to RSS Feed
- Mark Topic as New
- Mark Topic as Read
- Float this Topic for Current User
- Bookmark
- Subscribe
- Mute
- Printer Friendly Page
Turn on suggestions
Auto-suggest helps you quickly narrow down your search results by suggesting possible matches as you type.
Showing results for
Partner - Creator III
2016-06-29
05:40 AM
- Mark as New
- Bookmark
- Subscribe
- Mute
- Subscribe to RSS Feed
- Permalink
- Report Inappropriate Content
Is it a bug in Qlik Sense 3.0 ?
Hi,
I am creating a line chart with Year as dimension . What is appearing is x-axis showing year in thousand
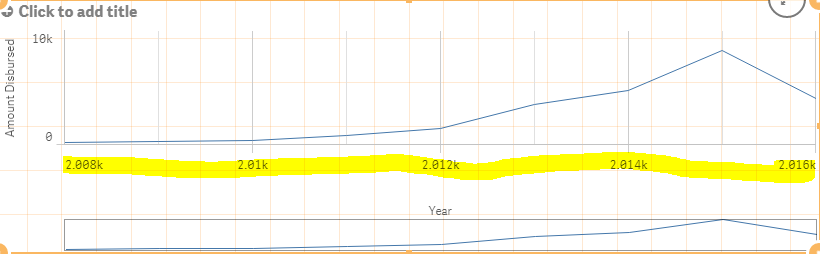
Please help?
679 Views
1 Solution
Accepted Solutions
Partner - Creator III
2016-06-29
06:10 AM
Author
- Mark as New
- Bookmark
- Subscribe
- Mute
- Subscribe to RSS Feed
- Permalink
- Report Inappropriate Content
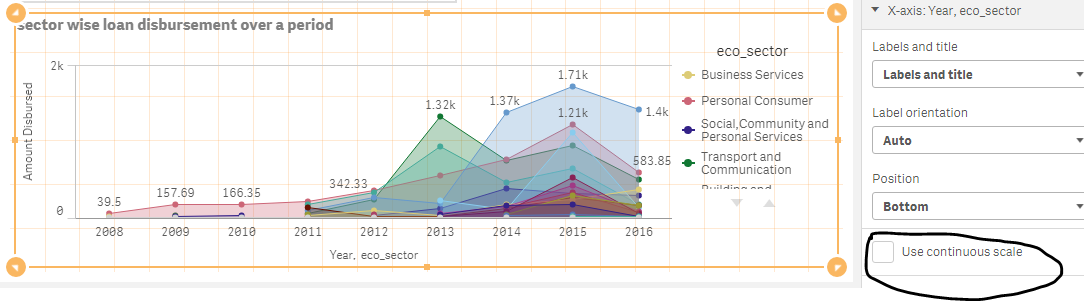
I found a work around, that is when I do not select "use continuous scale" in chart properties things are working as expected
392 Views
3 Replies
Specialist II
2016-06-29
05:47 AM
- Mark as New
- Bookmark
- Subscribe
- Mute
- Subscribe to RSS Feed
- Permalink
- Report Inappropriate Content
Hi Guruprem,
It seems the year dimension is recognised as a number.
Try the year extract by year() function, or format with date(), or combine to year(date([datecolumn]])), it should be work.
G.
392 Views
Partner - Creator III
2016-06-29
05:53 AM
Author
- Mark as New
- Bookmark
- Subscribe
- Mute
- Subscribe to RSS Feed
- Permalink
- Report Inappropriate Content
the year field is directly from script. it scripted as Year(Datefield).
392 Views
Partner - Creator III
2016-06-29
06:10 AM
Author
- Mark as New
- Bookmark
- Subscribe
- Mute
- Subscribe to RSS Feed
- Permalink
- Report Inappropriate Content
I found a work around, that is when I do not select "use continuous scale" in chart properties things are working as expected
393 Views
Community Browser