Unlock a world of possibilities! Login now and discover the exclusive benefits awaiting you.
- Qlik Community
- :
- Forums
- :
- Analytics
- :
- New to Qlik Analytics
- :
- Is it possible to add more than one expression in ...
- Subscribe to RSS Feed
- Mark Topic as New
- Mark Topic as Read
- Float this Topic for Current User
- Bookmark
- Subscribe
- Mute
- Printer Friendly Page
- Mark as New
- Bookmark
- Subscribe
- Mute
- Subscribe to RSS Feed
- Permalink
- Report Inappropriate Content
Is it possible to add more than one expression in Year over Year by month
Hi,
I am displaying line graph to show count of Invitation for current and previous Year.
Here Dimension:Year
Month
Expression : Count(Invitaion)
Now i need to add/Show one more count(Course Count) for current and previous Year in same graph.
but i am not able to add one more course count in graph because Add button itself Fadein(Not get highlighted).
So can please anybody explain or give some enlightment of YOY by month with More than one Expression, any link containing two counts with different year will do
Regards
- Tags:
- yoy
- Mark as New
- Bookmark
- Subscribe
- Mute
- Subscribe to RSS Feed
- Permalink
- Report Inappropriate Content
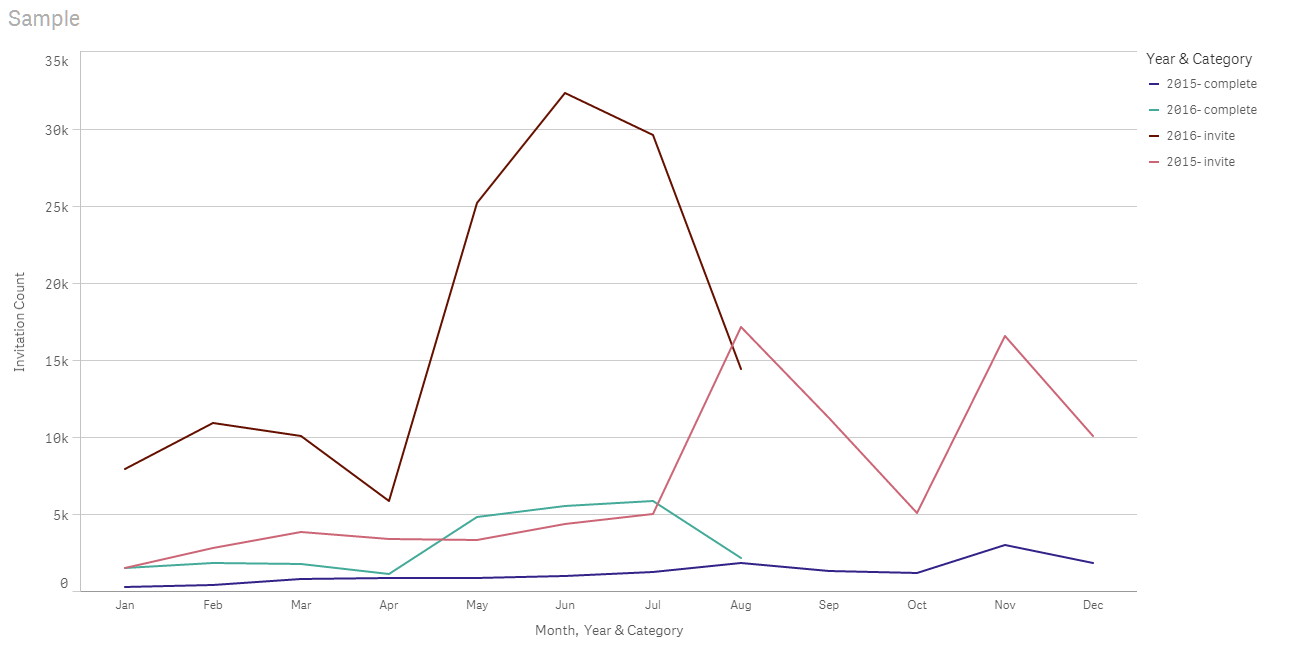
Something like this you had in mind?
- Mark as New
- Bookmark
- Subscribe
- Mute
- Subscribe to RSS Feed
- Permalink
- Report Inappropriate Content
Hi,
Thanks for reply
But while calculating Year Over Year by month i should take both dimension 1.)Month and 2.)Year right?
Can you please explain on this?
- Mark as New
- Bookmark
- Subscribe
- Mute
- Subscribe to RSS Feed
- Permalink
- Report Inappropriate Content
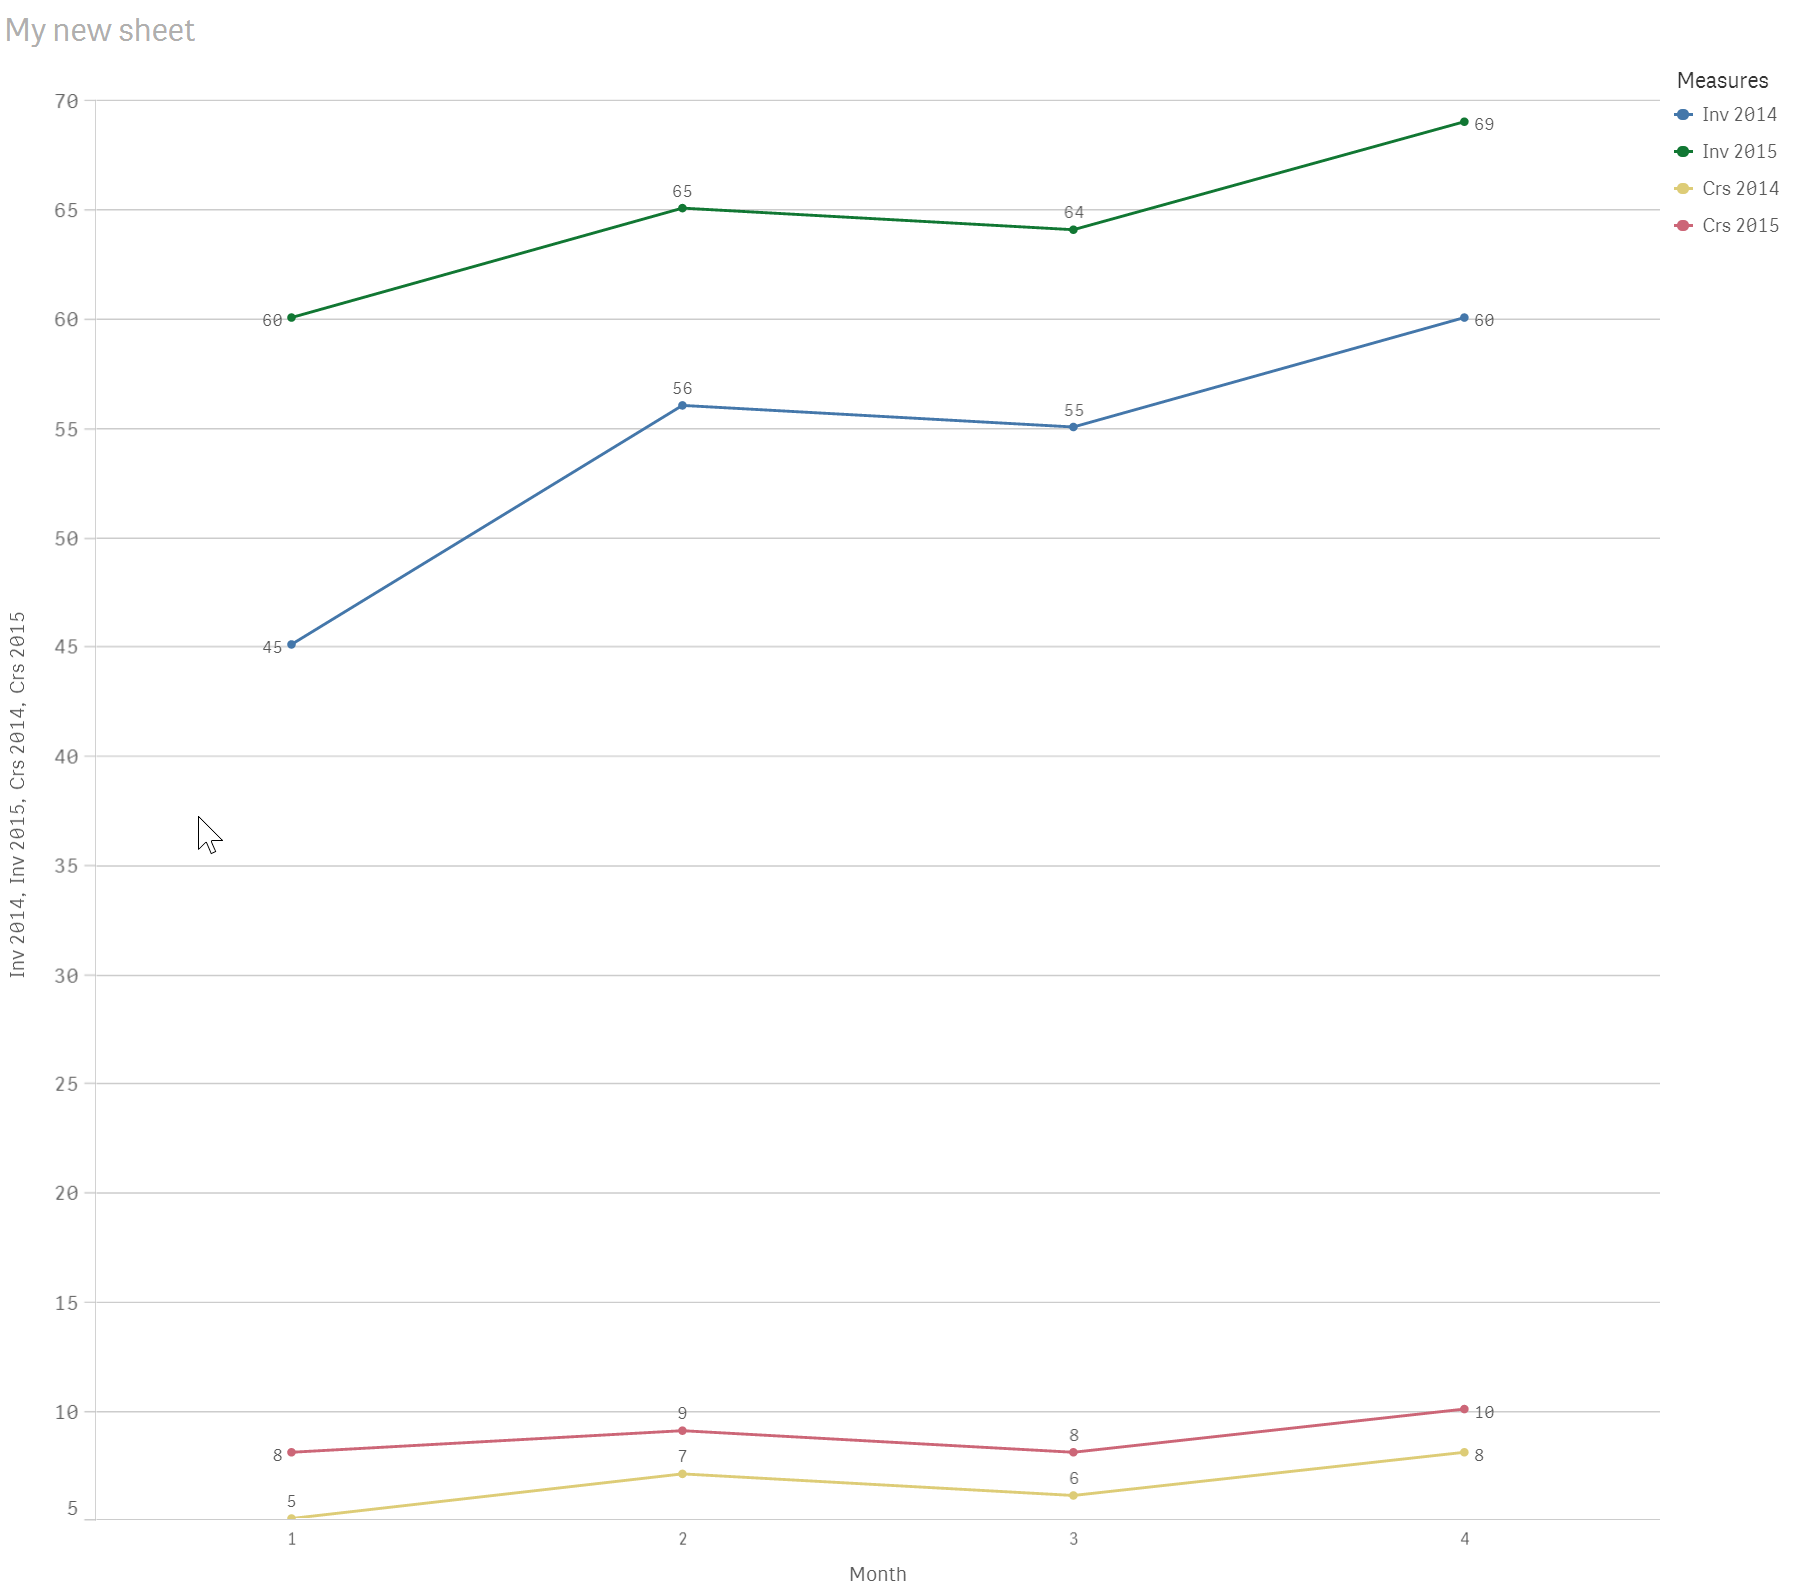
That depends on what kind of visualization you want to make. YoY is a "loose" term that doesn't prescribe whether you stack or sequence the years. The way I suggested by stacking them I have used a set expression to single out the values for a particular year and making each month more easily comparable to corresponding months from other years.
I have only chosen Month as a dimension and then I had to single out each year by a separate Measure and the way to single each year out was by using a set expression:
Sum( { <Year={2014}> } Inv )
The outer { and } tells Qlik Sense that we want to do further specification on which values that will be considered for the Sum() in the field of Inv. The base selections already implied are determined by what is selected in the user interface and also by the dimensions that have be selected in the chart that the expression belongs to.
The < and > telles Qlik Sense that we will modify the set of values by specifying some field selections. The Year is the name of the field that will be used for further selection and the set of values denoted within the inner { and } is that values that should be included in the selection.
So in this way we have simply selected all values of the Inv field that is associated with year 2014 and they are summed up to create a resulting value which will be calculated for each combination of dimensions. In this case the dimension is Month. Thus we have created a set of calculated values for the year 2014 and every month that has has a corresponding sum of values.
- Mark as New
- Bookmark
- Subscribe
- Mute
- Subscribe to RSS Feed
- Permalink
- Report Inappropriate Content
Hi,
Thanks petter-s for your time and help. It was very good explaination. I was able to get you by your Explaination and Qvf file. That was the answer i was looking for.
Little more clarific on my thought
I was confused with this kind of formula, for calculating YOY by month
YOY of Inv= Sum( { <Year={2014}> } Inv ) - Sum( { <Year={2013}> } Inv ).
at this time Dimension will be Year and Month
If i am using above kind, i get two lines for 2014 and 2013 of Sum(Inv). Now if i need to add one more 'YOY of Completion' for the same graph. Is it possible? I am asking this because, when i did sample like this i was not able to add one more Expression.
Is above Way Correct doing it?
- Mark as New
- Bookmark
- Subscribe
- Mute
- Subscribe to RSS Feed
- Permalink
- Report Inappropriate Content
Do you have an application you could share as I have a hard time understanding your issue... ?
- Mark as New
- Bookmark
- Subscribe
- Mute
- Subscribe to RSS Feed
- Permalink
- Report Inappropriate Content
Hi,
Please check attached file
Here i am not able to add one more Measure to same line graph
- Mark as New
- Bookmark
- Subscribe
- Mute
- Subscribe to RSS Feed
- Permalink
- Report Inappropriate Content
When you have more than one dimension Qlik Sense will not allow you to have multiple expressions. It is a limitation. Probably because it would be hard for Sense to figure out how to color categorization by year AND by the expression number. If however you do like I sugges by just having a single dimension you can make sure for each expression to include the year categorization so you get the level of control you need to have as many lines as you need.
With Month and Year as dimension you will only get as many lines as you have years and you are allowed to have just a single expression. If however you can create a dimension which is a combination of Year and your extra categorization and still have a single expression then it could work the way you "wish". But then the dimensions has to be Month and "YearAndSomeOtherCategoryCombined".
- Mark as New
- Bookmark
- Subscribe
- Mute
- Subscribe to RSS Feed
- Permalink
- Report Inappropriate Content
It could possibly made like this:
Dimension 2 would be:
Label: Year & Category
Definition in the "field" should be: =Year & ' - ' & If( IsNull(course_completion_id) , ' invite' , ' complete')
Notice the logic for the "field" above might not be working correctly for you but it gives you a hint on what you need to do