Unlock a world of possibilities! Login now and discover the exclusive benefits awaiting you.
- Qlik Community
- :
- Forums
- :
- Analytics
- :
- New to Qlik Analytics
- :
- Re: Rolling Sum of Month
- Subscribe to RSS Feed
- Mark Topic as New
- Mark Topic as Read
- Float this Topic for Current User
- Bookmark
- Subscribe
- Mute
- Printer Friendly Page
- Mark as New
- Bookmark
- Subscribe
- Mute
- Subscribe to RSS Feed
- Permalink
- Report Inappropriate Content
Issue with Grouping the Rolling Sum
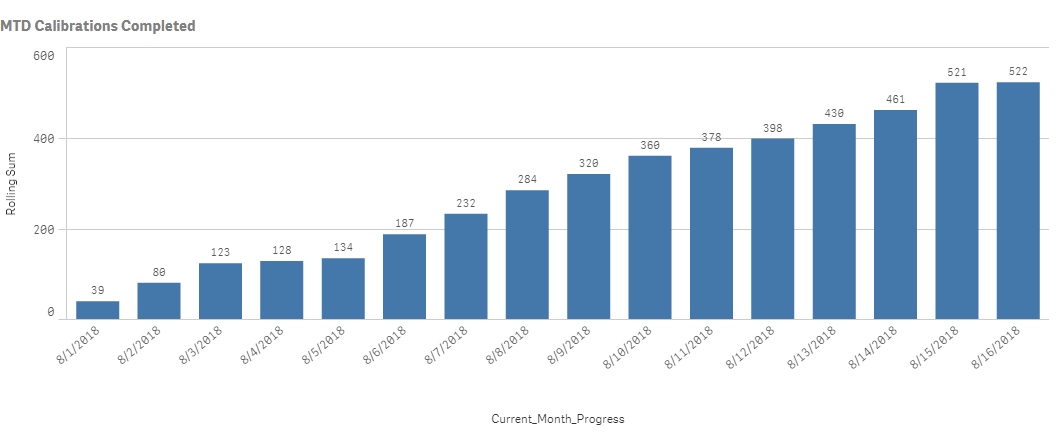
Hi, I'm trying to create a bar graph that shows me the rolling sum of the gauges completed in the current month like shown in the chart below:
Then I'm trying to show the sum broken down by Gage type but when I add a second dimension to the bar graph, it no longer takes the rolling sum of the days:
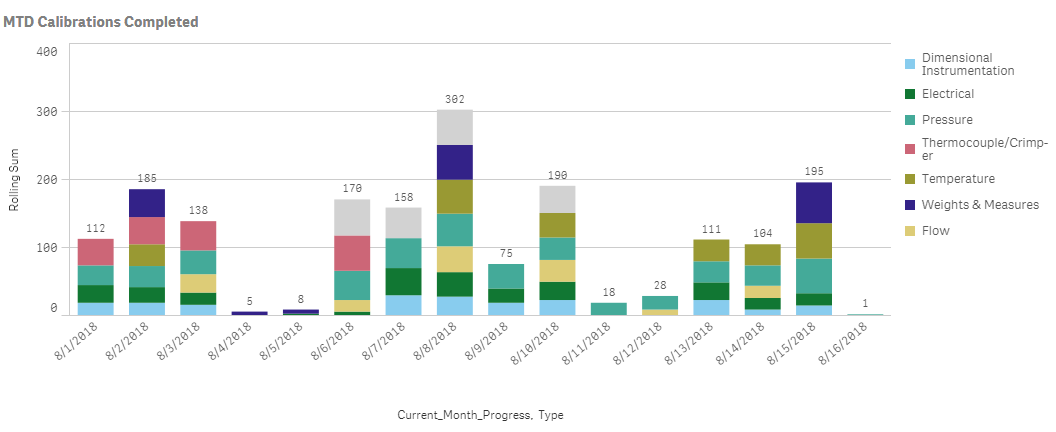
This is the equation I'm using for the Rolling Sum:
RangeSum(Above(Count({ $< [LAST_MODIFIED_DATE.autoCalendar.MonthRelNo]={0}, [LAST_MODIFIED_DATE.autoCalendar.YearsAgo]={0}, EVENT_STATUS = {'CHKOUT'} > } Distinct [GAGE_SN] ),0,Day(Today())))
Any help is appreciated
Thanks
- Mark as New
- Bookmark
- Subscribe
- Mute
- Subscribe to RSS Feed
- Permalink
- Report Inappropriate Content
do as follow:
aggr( RangeSum(Above(Count({ $< [LAST_MODIFIED_DATE.autoCalendar.MonthRelNo]={0}, [LAST_MODIFIED_DATE.autoCalendar.YearsAgo]={0}, EVENT_STATUS = {'CHKOUT'} > } Distinct [GAGE_SN] ),0,Day(Today()))) ,yourdim2, yourdim1)
- Mark as New
- Bookmark
- Subscribe
- Mute
- Subscribe to RSS Feed
- Permalink
- Report Inappropriate Content
Thanks for the response so quick but I'm not getting anything. It added a bunch of dates on my x-axis that from previous years so I'm no longer just on August 2018.
MyDim2 is simply type but MyDim1 is :Date([LAST_MODIFIED_DATE.autoCalendar.Date]). Could that be the issue?
- Mark as New
- Bookmark
- Subscribe
- Mute
- Subscribe to RSS Feed
- Permalink
- Report Inappropriate Content
can't u put a field as a dimension1? not a calculated one? and see if it does what u want?
- Mark as New
- Bookmark
- Subscribe
- Mute
- Subscribe to RSS Feed
- Permalink
- Report Inappropriate Content
I tried just using my field LAST_MODIFIED_DATE but it still isn't giving me a rolling sum. And it's still adding previous dates like before, I'm no longer just focused on August 2018 this way.
- Mark as New
- Bookmark
- Subscribe
- Mute
- Subscribe to RSS Feed
- Permalink
- Report Inappropriate Content
in the field label where you added the value on top of the graph bars. You can add an expression. And that expression can be this expression that you did.
- Mark as New
- Bookmark
- Subscribe
- Mute
- Subscribe to RSS Feed
- Permalink
- Report Inappropriate Content
May be modify expression like this:
RangeSum( Before(TOTAL Sum(Sales),0,ColumnNo(TOTAL)))