Unlock a world of possibilities! Login now and discover the exclusive benefits awaiting you.
- Qlik Community
- :
- Forums
- :
- Analytics
- :
- New to Qlik Analytics
- :
- Re: Last and Next 6 months in a bar chart
- Subscribe to RSS Feed
- Mark Topic as New
- Mark Topic as Read
- Float this Topic for Current User
- Bookmark
- Subscribe
- Mute
- Printer Friendly Page
- Mark as New
- Bookmark
- Subscribe
- Mute
- Subscribe to RSS Feed
- Permalink
- Report Inappropriate Content
Last and Next 6 months in a bar chart
Hi everyone,
I need to display in a bar chart last and next 6 months formatted as : dec 2019 gen 2020 etc etc
I saw other questions but the solutions are not working for me probably because i'm new to qlik.
I'm retrieving some data from a query and I need a dimension (MyOrderDate) as I specified and an Amount (=Sum(MyorderValue)) as measure. the result i want to achieve is like this.
Thank you in advance!
- Mark as New
- Bookmark
- Subscribe
- Mute
- Subscribe to RSS Feed
- Permalink
- Report Inappropriate Content
could you share the sample data sets and what your trying to achieve
- Mark as New
- Bookmark
- Subscribe
- Mute
- Subscribe to RSS Feed
- Permalink
- Report Inappropriate Content
I'm sorry but are private data sets.
I can give you some more information althoug, I'm retrieving from a table the list of currently open orders which has the amount of each order (in €) and the escape date of each order in every row.
now what I get is like that:
Order| TotalAmount| DateOfOrder
1 100€ 2019-12-01
2 300€ 2020-01-01
what i want to achieve is a graph as i showed in the question that shows me last and next 6 months as dimension and the total in € of all my orders as measure
- Mark as New
- Bookmark
- Subscribe
- Mute
- Subscribe to RSS Feed
- Permalink
- Report Inappropriate Content
Do you have the data for Next 6 months? if that is the case try like this in the chart
1.Create 2 variables like below
vLastsixMonth =AddMonths(Today(),-6)
vNextsixMonth =AddMonths(Today(),6)
In the Bar Chart
Dim : DateOfOrder
Expression: sum({<DateOfOrder={">=$(vLastsixMonth )<=$(vNextsixMonth )"}>}TotalAmount)
- Mark as New
- Bookmark
- Subscribe
- Mute
- Subscribe to RSS Feed
- Permalink
- Report Inappropriate Content
It says dimension not valid, my string is:
=sum({<Eorddataeva={">=$(vLastsixMonth)<=$(vNextsixMonth)"}>}Eordimporto)Eorddataeva is the DateofOrder
Eordimporto is the AmountOfTheOrder
I declared variables in my editor, is it right?
- Mark as New
- Bookmark
- Subscribe
- Mute
- Subscribe to RSS Feed
- Permalink
- Report Inappropriate Content
You need to create the variable in the front end at sheet level , check this link
- Mark as New
- Bookmark
- Subscribe
- Mute
- Subscribe to RSS Feed
- Permalink
- Report Inappropriate Content
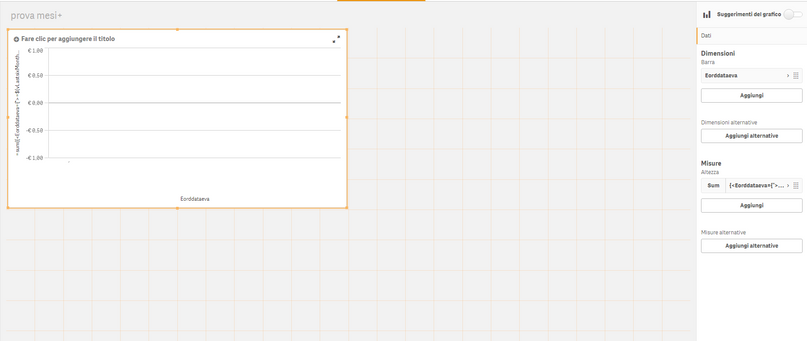
I've done what you said but i can't see anything,
dim: dateOfOrder
measure: string you've written
- Mark as New
- Bookmark
- Subscribe
- Mute
- Subscribe to RSS Feed
- Permalink
- Report Inappropriate Content
Dimension name you need to use according your data set in your case
Eorddateva
- Mark as New
- Bookmark
- Subscribe
- Mute
- Subscribe to RSS Feed
- Permalink
- Report Inappropriate Content
yes, i did it but doen't work, this is what i see

