Unlock a world of possibilities! Login now and discover the exclusive benefits awaiting you.
- Qlik Community
- :
- Forums
- :
- Analytics
- :
- New to Qlik Analytics
- :
- Line Chart - Contious Dimensions & data dissapeari...
- Subscribe to RSS Feed
- Mark Topic as New
- Mark Topic as Read
- Float this Topic for Current User
- Bookmark
- Subscribe
- Mute
- Printer Friendly Page
- Mark as New
- Bookmark
- Subscribe
- Mute
- Subscribe to RSS Feed
- Permalink
- Report Inappropriate Content
Line Chart - Contious Dimensions & data dissapearing
Hello,
I have following chart with a continuous scale and a Drill Down where I go from product grouping to product detail.
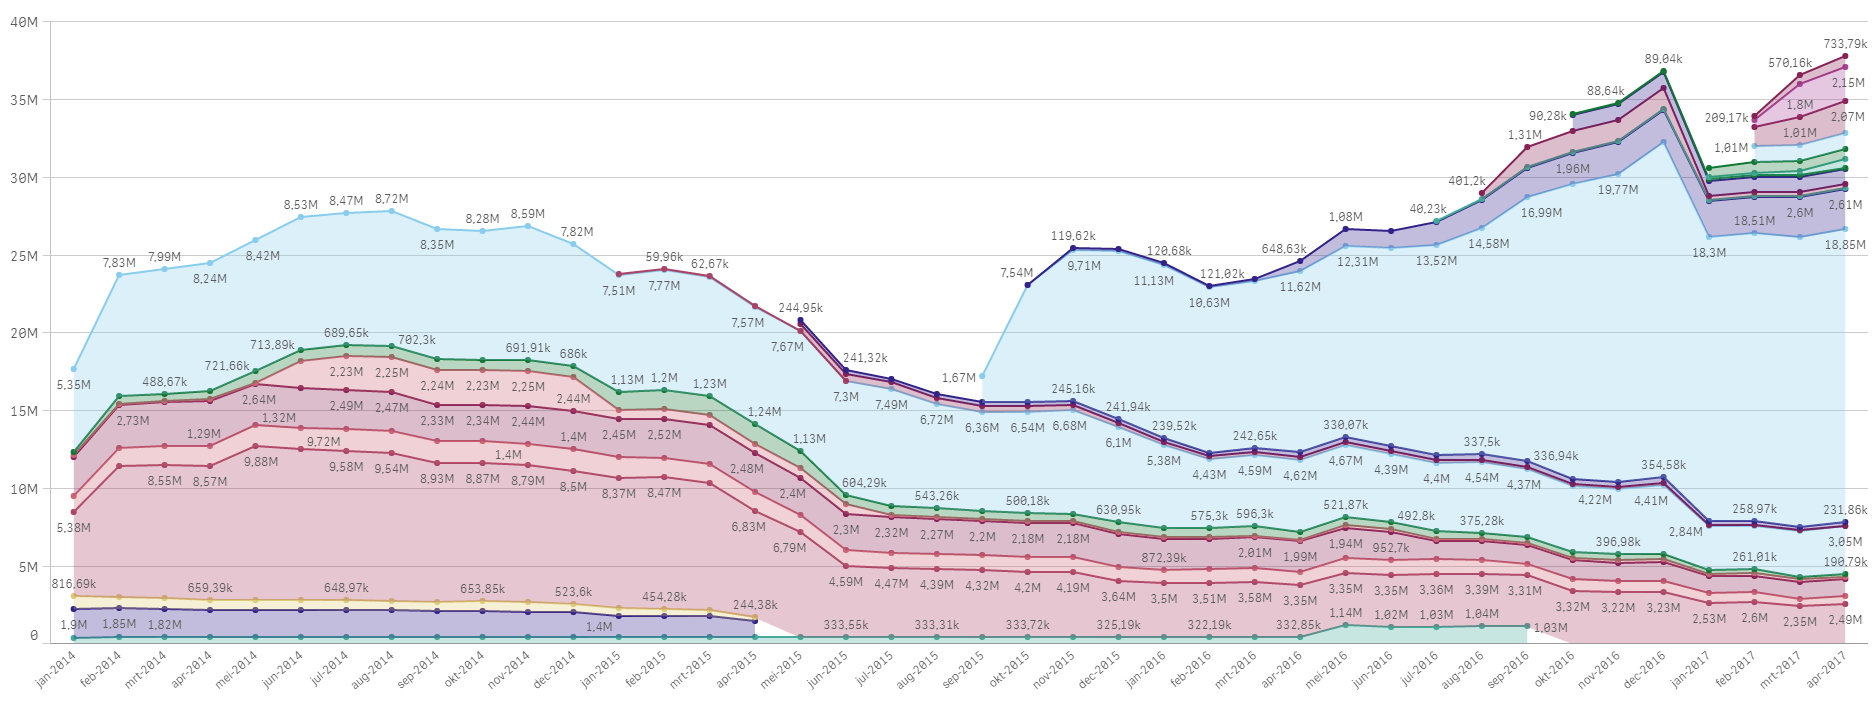
Chart 1 & 3 have exactly the same totals in the graph, only difference is that chart 3 gives detail on product level.
The only thing I changed between Chart 3 & 2, is using the Continious Scale setting, but apparantly this deletes certain data.
Anyone who can help me with this problem?
When I look at the data in a table, I don't have the problem.
Chart 1 - Product Group Chart (correct data for one Product Group)
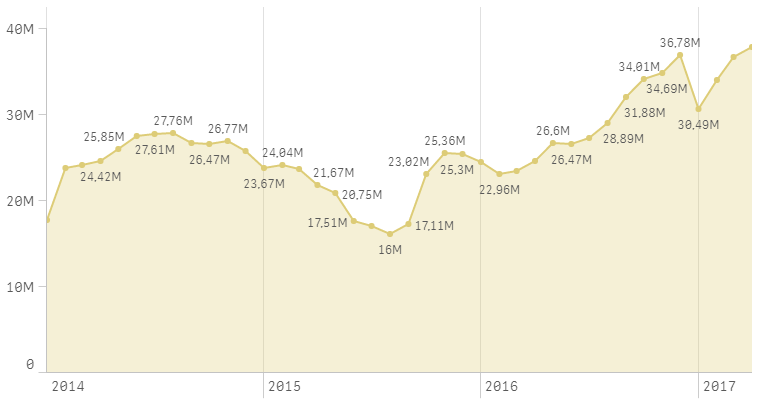
Chart 2 - Product Detail Chart - continuous (data is not correct for Product Details)
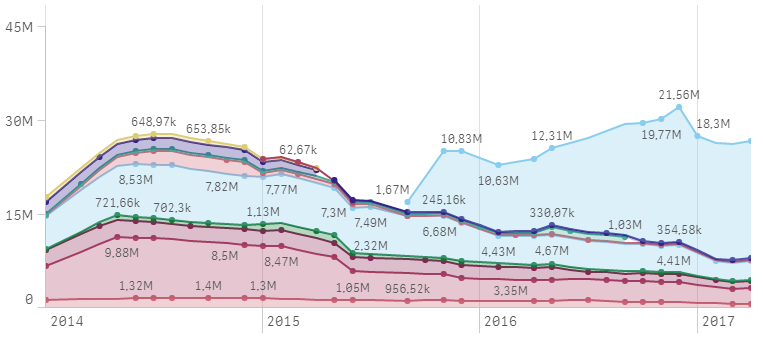
Chart 3 - Product Detail Chart - non continuous (data is correct for Product Details)
- Tags:
- continuous
- line chart