Unlock a world of possibilities! Login now and discover the exclusive benefits awaiting you.
- Qlik Community
- :
- Forums
- :
- Analytics
- :
- New to Qlik Analytics
- :
- Line Graph with 2 dimensions and 1 measure over ti...
- Subscribe to RSS Feed
- Mark Topic as New
- Mark Topic as Read
- Float this Topic for Current User
- Bookmark
- Subscribe
- Mute
- Printer Friendly Page
- Mark as New
- Bookmark
- Subscribe
- Mute
- Subscribe to RSS Feed
- Permalink
- Report Inappropriate Content
Line Graph with 2 dimensions and 1 measure over time
Hi
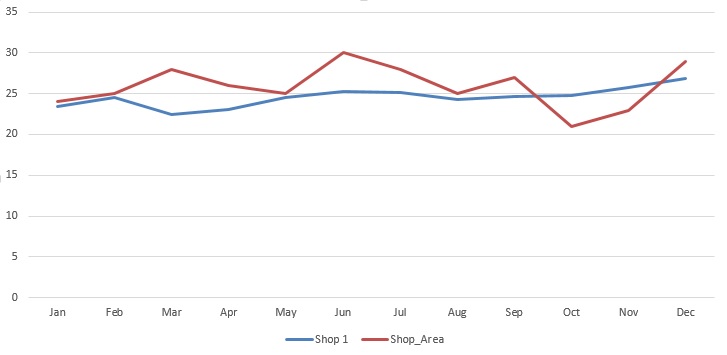
Is it possible to create a line graph showing 2 dimensions over time, as shown in the pic below?
In my data I have several shops in an Area. I want to see how a certain shop is performing measured against the Area it is in.
Thank you
Ettiene
- Mark as New
- Bookmark
- Subscribe
- Mute
- Subscribe to RSS Feed
- Permalink
- Report Inappropriate Content
Would you be able to share some raw data behind this sort of output?
- Mark as New
- Bookmark
- Subscribe
- Mute
- Subscribe to RSS Feed
- Permalink
- Report Inappropriate Content
Have you tried using the reference line for your Area?
- Mark as New
- Bookmark
- Subscribe
- Mute
- Subscribe to RSS Feed
- Permalink
- Report Inappropriate Content
use month as dimension and 2 expression each one with defined dimension via set analysis
- Mark as New
- Bookmark
- Subscribe
- Mute
- Subscribe to RSS Feed
- Permalink
- Report Inappropriate Content
Depending on how you data is organized, you can either have 2 Dimensions (Month, Shop) with a measure of sales or as Robin indicates, 1 Dimension and 2 measures, one for each shop.
The first method would automatically acccomodate a 3rd shop....