Unlock a world of possibilities! Login now and discover the exclusive benefits awaiting you.
Announcements
Introducing Qlik Answers: A plug-and-play, Generative AI powered RAG solution.
READ ALL ABOUT IT!
- Qlik Community
- :
- Forums
- :
- Analytics
- :
- New to Qlik Analytics
- :
- Line chart - Currently showing a limited data set
Options
- Subscribe to RSS Feed
- Mark Topic as New
- Mark Topic as Read
- Float this Topic for Current User
- Bookmark
- Subscribe
- Mute
- Printer Friendly Page
Turn on suggestions
Auto-suggest helps you quickly narrow down your search results by suggesting possible matches as you type.
Showing results for
Contributor II
2023-05-22
04:30 AM
- Mark as New
- Bookmark
- Subscribe
- Mute
- Subscribe to RSS Feed
- Permalink
- Report Inappropriate Content
Line chart - Currently showing a limited data set
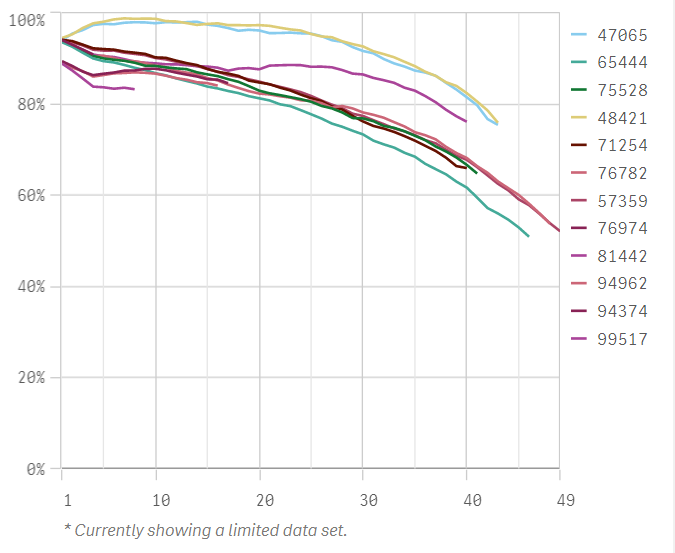
Hi Team, I have created a line chart. I have set x-axis to Continuous scale, there's a line saying 'Currently showing a limited data set' displayed at the bottom of the chart. The chart x-axis has values from 1-51 but some of the data is missing. As shown in the attached screenshot, the legend is displaying only 50% of the total items. the data for all the remaining items is missing.
How to display the whole data without a scroll bar? Can anyone please help me with the same.
Thank you!
Labels (8)
Labels
- Subscribe by Topic:
-
Chart
-
Developers
-
dimension
-
expression
-
General Question
-
Set Analysis
-
Variables
-
Visualization
413 Views
1 Reply
Specialist
2023-05-22
05:02 AM
- Mark as New
- Bookmark
- Subscribe
- Mute
- Subscribe to RSS Feed
- Permalink
- Report Inappropriate Content
maybe due to limitation of chart object.
Please refer below article for details:

Regards,
Aditya
398 Views
Community Browser