Unlock a world of possibilities! Login now and discover the exclusive benefits awaiting you.
- Qlik Community
- :
- Forums
- :
- Analytics
- :
- New to Qlik Analytics
- :
- Line chart not shows Month Year name
- Subscribe to RSS Feed
- Mark Topic as New
- Mark Topic as Read
- Float this Topic for Current User
- Bookmark
- Subscribe
- Mute
- Printer Friendly Page
- Mark as New
- Bookmark
- Subscribe
- Mute
- Subscribe to RSS Feed
- Permalink
- Report Inappropriate Content
Line chart not shows Month Year name
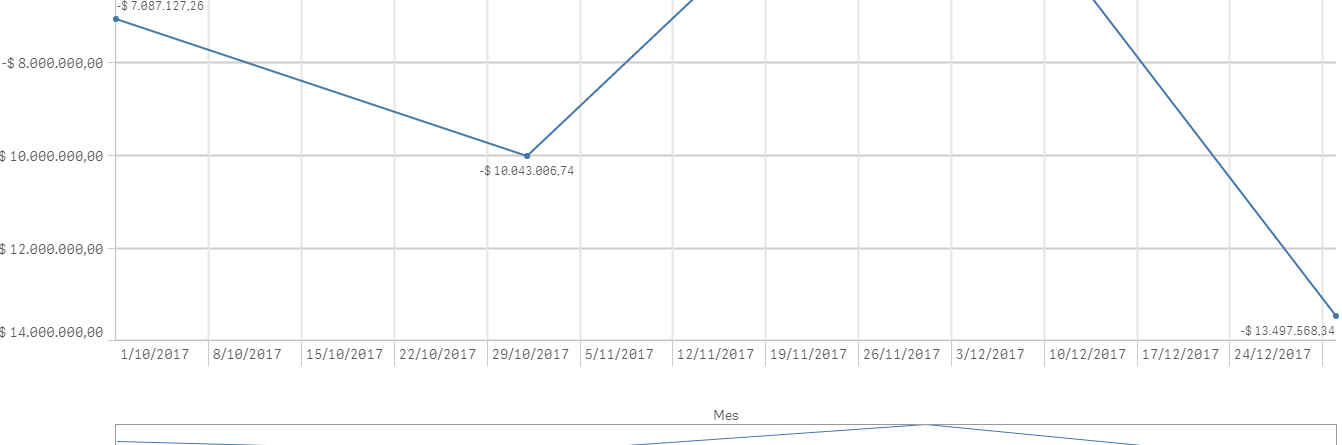
Hello, I use Master Calendar and I create al line chart with dimension "MonthYear" and a measure. In the X-axis I get: http://prntscr.com/i7m7j0 and I want to get oct-2017, nov-2017, etc...
Why not works?
Thanks!
Edit: reuploaded image
- Tags:
- mastercalendar
Accepted Solutions
- Mark as New
- Bookmark
- Subscribe
- Mute
- Subscribe to RSS Feed
- Permalink
- Report Inappropriate Content
- Mark as New
- Bookmark
- Subscribe
- Mute
- Subscribe to RSS Feed
- Permalink
- Report Inappropriate Content
I found a workaround. Converting the chart to bar chart shows the month names correctly... but if I want a line chart is there a way to do this?
- Mark as New
- Bookmark
- Subscribe
- Mute
- Subscribe to RSS Feed
- Permalink
- Report Inappropriate Content
I am unable to see the image from the url that you have posted, can you repost the image here?
- Mark as New
- Bookmark
- Subscribe
- Mute
- Subscribe to RSS Feed
- Permalink
- Report Inappropriate Content
I reuploaded the image in my original post
- Mark as New
- Bookmark
- Subscribe
- Mute
- Subscribe to RSS Feed
- Permalink
- Report Inappropriate Content
May be try this as your dimension?
Date(MonthStart(YourDimension), 'MMM-YYYY')
- Mark as New
- Bookmark
- Subscribe
- Mute
- Subscribe to RSS Feed
- Permalink
- Report Inappropriate Content
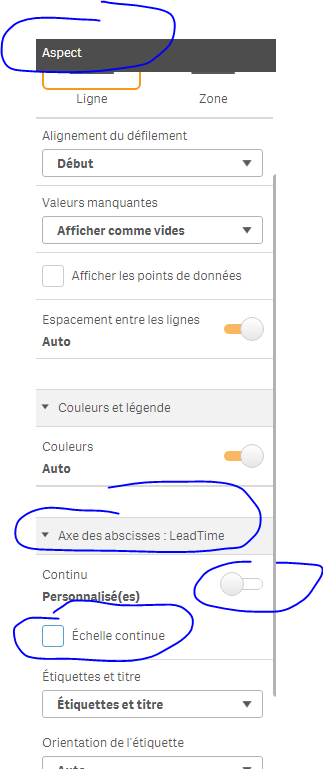
under aspect> x-axis: uncheck the "continue" option:
- Mark as New
- Bookmark
- Subscribe
- Mute
- Subscribe to RSS Feed
- Permalink
- Report Inappropriate Content
I am facing the same issue with trendlines.
Date(MonthStart(YourDimension), 'MMM-YYYY') this doesnt help change x axis labels for line chart. It just changes the formatting of date for popover when you hover over a data point.
If i convert the same graph with same formulas to bar chart that does it but i am not getting Jul-18 as a monthyear format with Date(Num#([MonthYear]),'MMM-YY') in trendlines [ Num# because i have a crosstable]