Unlock a world of possibilities! Login now and discover the exclusive benefits awaiting you.
- Qlik Community
- :
- Forums
- :
- Analytics
- :
- New to Qlik Analytics
- :
- Linear Regression like Reference Line (Scatter-Plo...
Options
- Subscribe to RSS Feed
- Mark Topic as New
- Mark Topic as Read
- Float this Topic for Current User
- Bookmark
- Subscribe
- Mute
- Printer Friendly Page
Turn on suggestions
Auto-suggest helps you quickly narrow down your search results by suggesting possible matches as you type.
Showing results for
Creator
2018-07-16
05:01 AM
- Mark as New
- Bookmark
- Subscribe
- Mute
- Subscribe to RSS Feed
- Permalink
- Report Inappropriate Content
Linear Regression like Reference Line (Scatter-Plot)
Hi everyone,
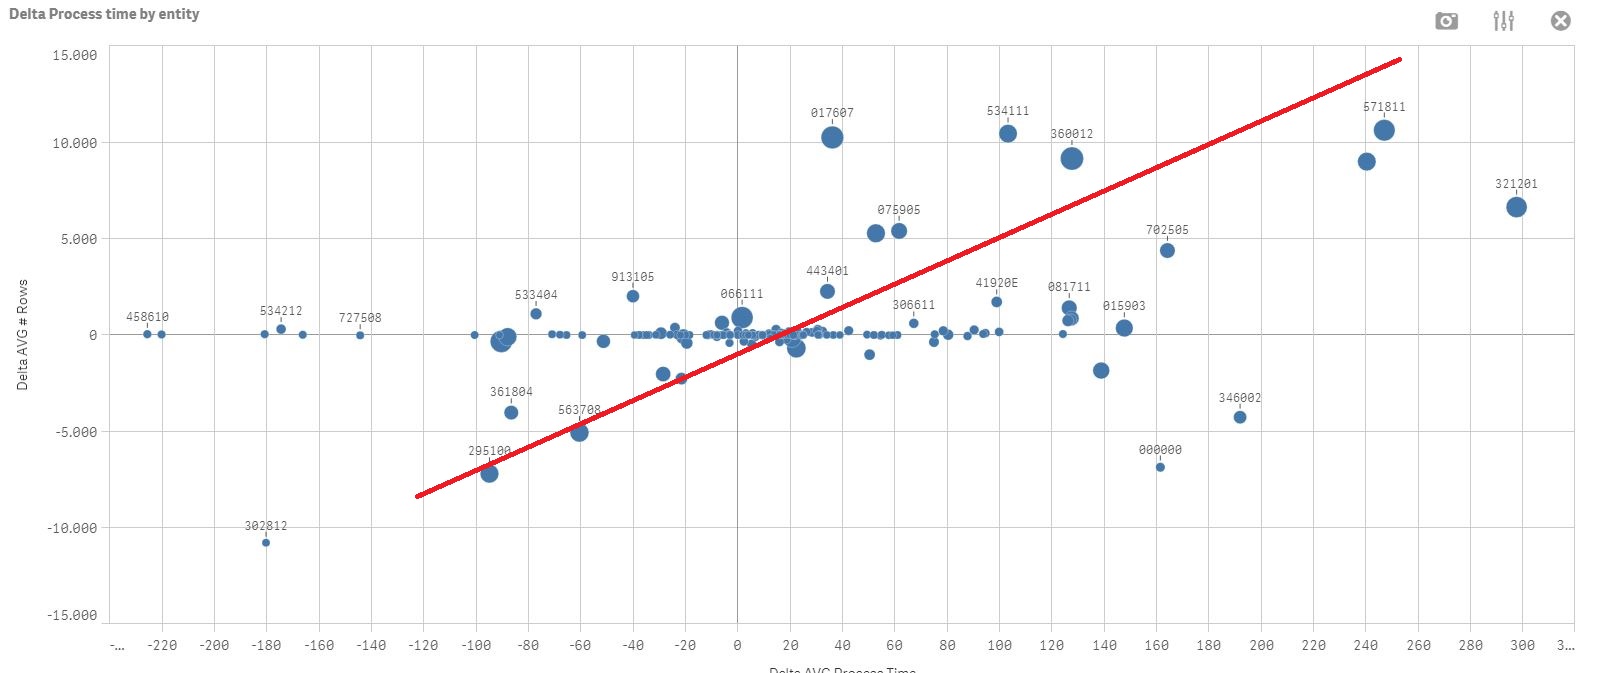
I need to add a linear regression to a scatter plot like a reference line.
Here an example:
How I can to do it?
Thanks,
Livio
3,080 Views
4 Replies
Creator III
2018-07-16
05:11 AM
- Mark as New
- Bookmark
- Subscribe
- Mute
- Subscribe to RSS Feed
- Permalink
- Report Inappropriate Content
2,892 Views
Creator
2018-07-16
05:22 AM
Author
- Mark as New
- Bookmark
- Subscribe
- Mute
- Subscribe to RSS Feed
- Permalink
- Report Inappropriate Content
Sorry, but I don't understand.
I need to add a linear regression about "Delta AVG Process Time".
I attached a simple of Application with the scatter plot where i want to have a reference line.
2,892 Views
Master
2018-07-16
12:04 PM
- Mark as New
- Bookmark
- Subscribe
- Mute
- Subscribe to RSS Feed
- Permalink
- Report Inappropriate Content
In your scatter plot, add an extra measure as:
linest_m(total aggr(if(sum(DeltaAVG#Rows),sum(DeltaAVG#Rows)),DeltaAVGProcessTime),DeltaAVGProcessTime) *
only({1}DeltaAVGProcessTime) +
linest_b(total aggr(if(sum(DeltaAVG#Rows),sum(DeltaAVG#Rows)),DeltaAVGProcessTime),DeltaAVGProcessTime).
2,892 Views
Creator
2018-07-19
11:19 AM
Author
- Mark as New
- Bookmark
- Subscribe
- Mute
- Subscribe to RSS Feed
- Permalink
- Report Inappropriate Content
not work 
2,892 Views
Community Browser