- Mark as New
- Bookmark
- Subscribe
- Mute
- Subscribe to RSS Feed
- Permalink
- Report Inappropriate Content
Max value aggregate Qlik sense
hi, I am new to Qlik sense.
I am trying to create an expression. I have property id's, price and their number of reviews. So i have to calculate which highly priced property has how many reviews?
I made a bar chart and set price [created a master item i.e. Max(Price)] and property id and set them both as 2 dimensions and Reviews as measure i.e. Count(Reviews). But I am not getting the correct graph for that.
Please tell me what should be the expression for it and how do I set my dimensions and measures.
- Mark as New
- Bookmark
- Subscribe
- Mute
- Subscribe to RSS Feed
- Permalink
- Report Inappropriate Content
Can you share some data?
- Mark as New
- Bookmark
- Subscribe
- Mute
- Subscribe to RSS Feed
- Permalink
- Report Inappropriate Content
Here I have attached the data.
| Property_id | Number_of_Reviews | Price |
| 11675715 | 51 | 85 |
| 11675715 | 21 | 65 |
| 9147025 | 30 | 125 |
| 5557381 | 75 | 69 |
| 6627449 | 12 | 125 |
| 1886820 | 0 | 300 |
| 16042478 | 0 | 200 |
| 11675715 | 21 | 99 |
| 9115700 | 0 | 139 |
| 15220538 | 5 | 110 |
| 773041 | 62 | 39 |
| 260566 | 20 | 40 |
| 715270 | 103 | 39 |
| 14872953 | 17 | 52 |
| 3429765 | 61 | 45 |
| 3435196 | 11 | 40 |
I have find the highly priced listings and their number of reviews. Also I have same property ids who have different prices. so also have to find the highest price of them and then map it. can you please tell me that shall I set price as a dimension along with property id and number of reviews as measure???
- Mark as New
- Bookmark
- Subscribe
- Mute
- Subscribe to RSS Feed
- Permalink
- Report Inappropriate Content
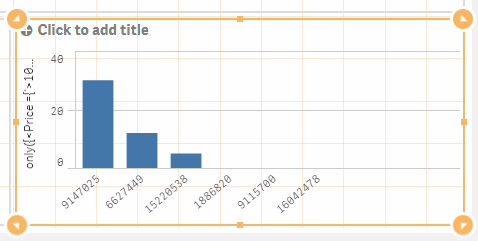
Maybe this can help
only({<Price ={'>100'}>}Number_of_Reviews)
- Mark as New
- Bookmark
- Subscribe
- Mute
- Subscribe to RSS Feed
- Permalink
- Report Inappropriate Content
So do I set the price and property id both as dimensions and reviews as measure in this case? and Also Is there any need to use the Max function?
- Mark as New
- Bookmark
- Subscribe
- Mute
- Subscribe to RSS Feed
- Permalink
- Report Inappropriate Content
In Bar chart i think you can have only one Dim.
so i am not being able to see what exactlly you are look for. you can try use rank in there as well
Regards
- Mark as New
- Bookmark
- Subscribe
- Mute
- Subscribe to RSS Feed
- Permalink
- Report Inappropriate Content
Hi Sara,
Did you mean sum(Review) of highest price and aggr these by Property_ID ?
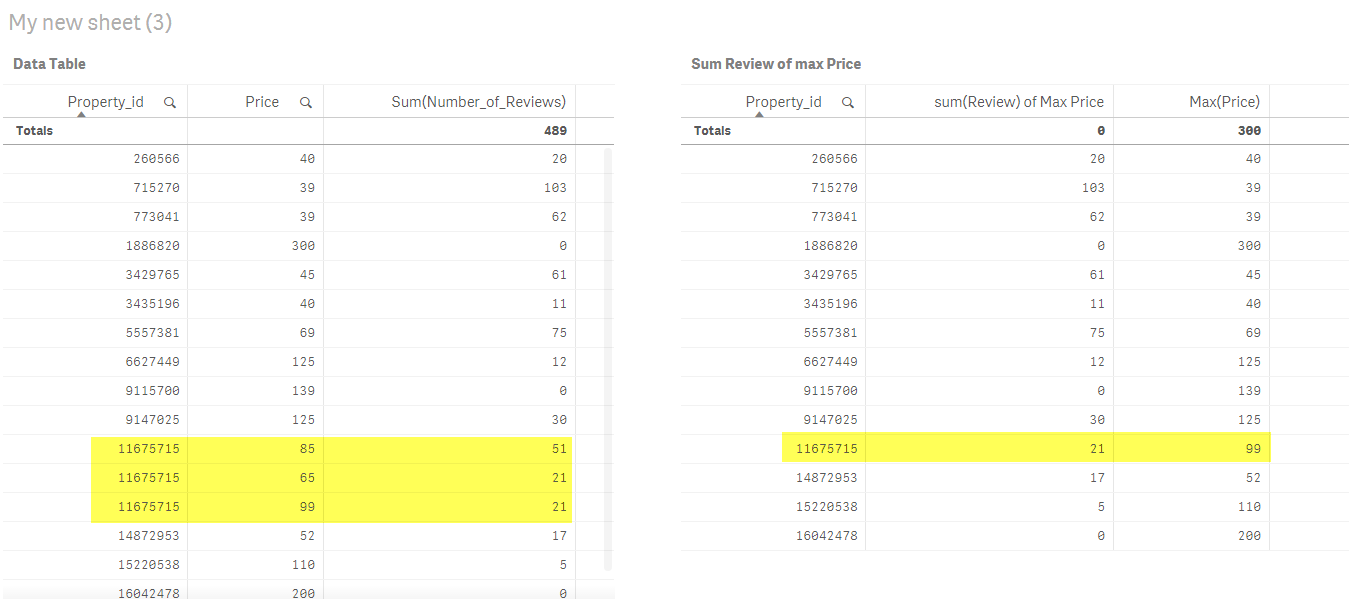
Try this Measure: FirstSortedValue(aggr(sum({<Price=>}Number_of_Reviews),Property_id,Price),-Price)
Hope this helps,
Justin.