Unlock a world of possibilities! Login now and discover the exclusive benefits awaiting you.
- Qlik Community
- :
- Forums
- :
- Analytics
- :
- New to Qlik Analytics
- :
- Re: Monitoring App Error Qlik Sense
- Subscribe to RSS Feed
- Mark Topic as New
- Mark Topic as Read
- Float this Topic for Current User
- Bookmark
- Subscribe
- Mute
- Printer Friendly Page
- Mark as New
- Bookmark
- Subscribe
- Mute
- Subscribe to RSS Feed
- Permalink
- Report Inappropriate Content
Monitoring App Error Qlik Sense
Hi Everyone
I cannot see any data in monitoring app.
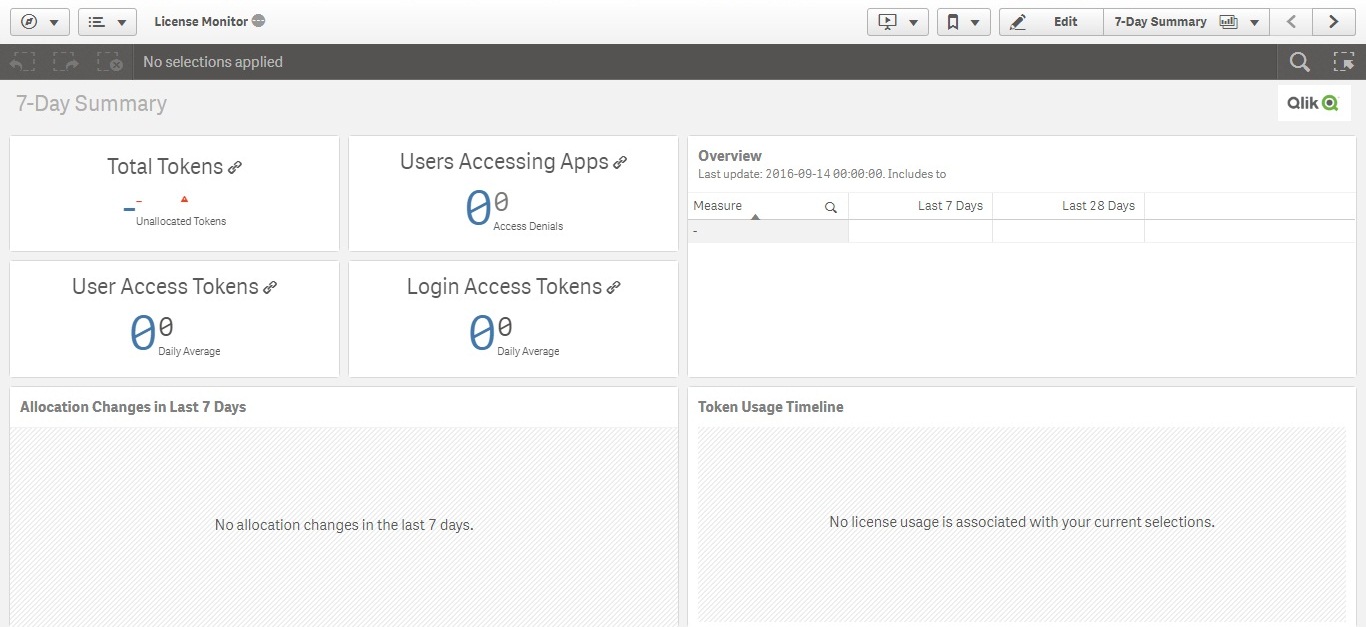
I tried to schedule a task, but failed.
PFA log file
- Mark as New
- Bookmark
- Subscribe
- Mute
- Subscribe to RSS Feed
- Permalink
- Report Inappropriate Content
Hii Ahsan,
It looks like a database authorization problem, so there is no data.
2018-01-07 14:09:50 Error: Connector reply error: Unable to connect to database:
2018-01-07 14:09:50 Error message:
2018-01-07 14:09:50 Please check the values for Username‚ Password‚ Host and other properties.
2018-01-07 14:09:50 Description: Access credentials are not valid for this connection.
You should ask from the database administrator permission to access the data.
Hope I helped.
Sam
- Mark as New
- Bookmark
- Subscribe
- Mute
- Subscribe to RSS Feed
- Permalink
- Report Inappropriate Content
Hi Shahzad,
regarding the error pointed out by samuel, I think this is not the case.
From QS September 2017 there is also the possibility to install a repository to store the logs.
Unluckily, logs are also stored as files (as usual). Monitoring Apps (Operations, License, Log, Reloads, Sessions) have now a variable in the script, that can be configured to:
a) read logs only from the new repository
b) read logs only from files
c) both
By default the variable is set to read both from logs and files, so a connection test to the repository is done.
In case the repository has not been set (or the credentials are wrong) you'll get the said error.
Regarding the 401 error you're receiving at the end of the log, are you using form authentication?
Monitoring apps use also REST connections that requires you to have a Virtual Proxy with Windows authentication. This can also be a different VP (not the default one), so you can set a new one only for monitoring apps and you can modify each connection to point to that VP.
Hope this helps
Cheers,
Riccardo
- Mark as New
- Bookmark
- Subscribe
- Mute
- Subscribe to RSS Feed
- Permalink
- Report Inappropriate Content
Hi Riccardo
Thanks for your reply.
I have upgraded QS Sept 2017 to QS Nov 2017
I want to know where to put the credentials
- Mark as New
- Bookmark
- Subscribe
- Mute
- Subscribe to RSS Feed
- Permalink
- Report Inappropriate Content
Hi Shahzad,
you mean the Log repository credentials?
You should be able to see from QMC a data connection called QLogs, that uses the user qlogs_reader.
It should be automatic, but if this is not the case provide the password and then apply changes.
Please be aware also that, in caso of a multinode site, you possibly need to change the localhost in the connection string.
Note also that, even if the Log repository has not been created, the connection will be there and will require to be modified once (*if) you set up the Log repository.
Hope this helps
Cheers,
Riccardo
- Mark as New
- Bookmark
- Subscribe
- Mute
- Subscribe to RSS Feed
- Permalink
- Report Inappropriate Content
Hi Riccardo
I can see qlogs_reader under QLogs dataconnection
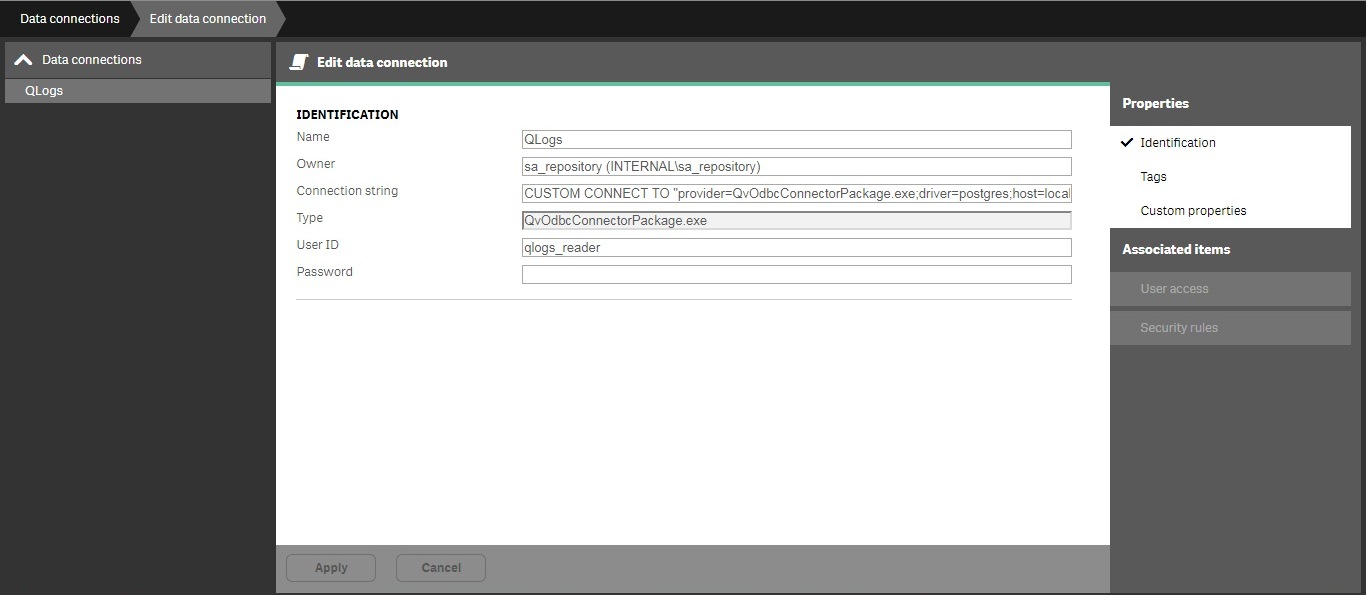
I have provided the password, then also same problem occured.
I have changed the host name in place of localhost in the connection string , then also same problem.
- Mark as New
- Bookmark
- Subscribe
- Mute
- Subscribe to RSS Feed
- Permalink
- Report Inappropriate Content
Same issue here. Found in November Patch 1 and 2 documentation something that looks like related with this.
But didn't find this lines to edit them:
Workaround: When upgrading to November 2017 release and using Reloads Monitor for first time, either request the September 2017 version of the Reloads Monitor from Qlik or modify the script of the November 2017 Reloads Monitor as follows:
- In the defineFields section, replace lines 16 and 17 with “Lower(Hostname) as Hostname,”
- In the database_load section, replace lines 41 and 42 with: “stop_time”, “executing_node_name”
- Also in database_load section, replace lines 14 and 15 with “Lower(process_host) as Hostname”
I'll try to apply the patch and ping you later.
- Mark as New
- Bookmark
- Subscribe
- Mute
- Subscribe to RSS Feed
- Permalink
- Report Inappropriate Content
Nevermind. It was not a patch issue.
I think I missed something during upgrade and missing the logging database config. So:
- Or you'd setup the logging database (check in PgAdmin if QLogs db was created);
- Or you'd force the Licence Monitor to use only the file logs setting SET db_v_file_override = 1 in "Initialize" section;
Similar issue here.
- Mark as New
- Bookmark
- Subscribe
- Mute
- Subscribe to RSS Feed
- Permalink
- Report Inappropriate Content
Hi guys please follow the below document to reslove the monitoring application
- Mark as New
- Bookmark
- Subscribe
- Mute
- Subscribe to RSS Feed
- Permalink
- Report Inappropriate Content
Hi!
Any solutions about this topic? i have the same problem
thanks!