Unlock a world of possibilities! Login now and discover the exclusive benefits awaiting you.
Announcements
July 15, NEW Customer Portal: Initial launch will improve how you submit Support Cases.
IMPORTANT DETAILS
- Qlik Community
- :
- Forums
- :
- Analytics
- :
- New to Qlik Analytics
- :
- Moving 31-Day Sales with Week Number as a Dimensio...
Options
- Subscribe to RSS Feed
- Mark Topic as New
- Mark Topic as Read
- Float this Topic for Current User
- Bookmark
- Subscribe
- Mute
- Printer Friendly Page
Turn on suggestions
Auto-suggest helps you quickly narrow down your search results by suggesting possible matches as you type.
Showing results for
Not applicable
2016-06-21
01:01 AM
- Mark as New
- Bookmark
- Subscribe
- Mute
- Subscribe to RSS Feed
- Permalink
- Report Inappropriate Content
Moving 31-Day Sales with Week Number as a Dimension
Hi Guys!
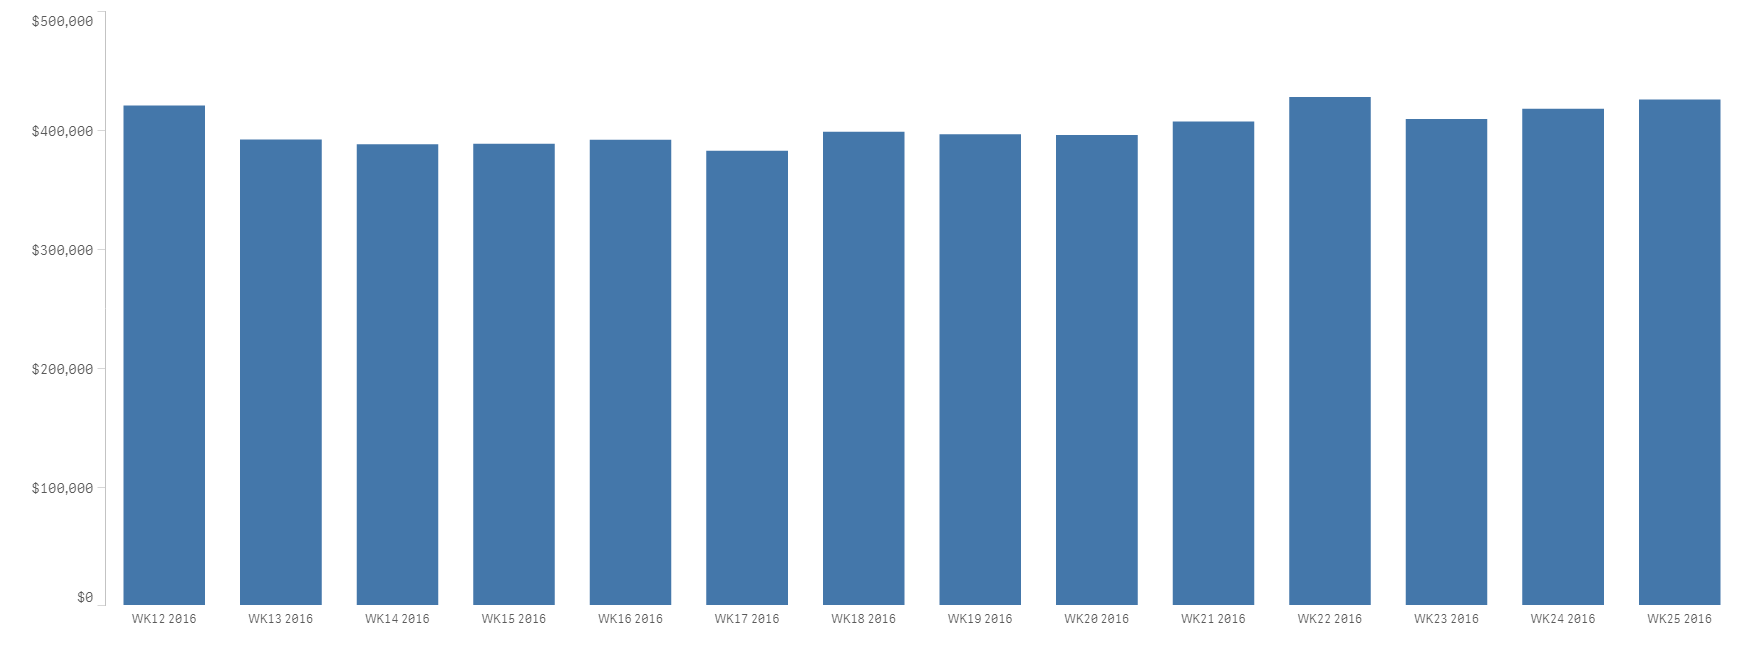
I want to create a column chart with week number as a dimension and the measure of each would be each week's accumulated sales 31 days back. (e.g WK25 = Sum of May 20 until Jun 19 2016 Sales, WK24 = May 13 to Jun 12 2016 Sales, so on.)
I imagine it to be like this:
Is it attainable to insert a set analysis? or would it be better to code in the data load?
Thanks! 
215 Views
0 Replies
Community Browser