Unlock a world of possibilities! Login now and discover the exclusive benefits awaiting you.
- Qlik Community
- :
- Forums
- :
- Analytics
- :
- New to Qlik Analytics
- :
- (Multiple) Alternate States or in expression
- Subscribe to RSS Feed
- Mark Topic as New
- Mark Topic as Read
- Float this Topic for Current User
- Bookmark
- Subscribe
- Mute
- Printer Friendly Page
- Mark as New
- Bookmark
- Subscribe
- Mute
- Subscribe to RSS Feed
- Permalink
- Report Inappropriate Content
(Multiple) Alternate States or in expression
Hi all,
I'm struggling with Alternate States and/or using them in Expressions.
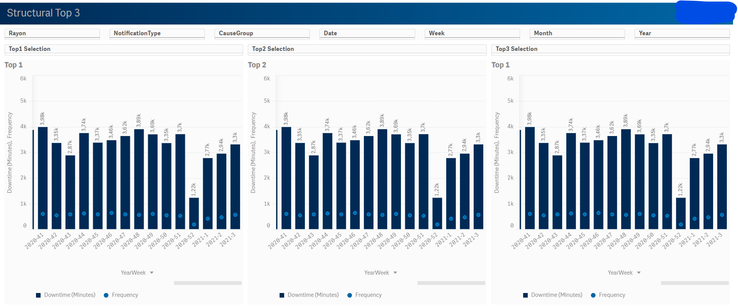
I have a downtime app with a "Structural Top 3" sheet for daily/ weekly/ monthly follow-up.
The three Selection Filter panes and the graphs are connected with 3 individual Alternate States.
But the graphs should also be affected by the top filter pane, because the Top 3 should be possible to be viewed by area.
I have tried to incorporate the Alternate States into the expressions, but then the graphs don't change based on the Topx Selections. I tried adding *$ in the expression but that doesn't seem to do the trick either.
Sum({[Top1 Selection * $]}{<FunctionalLocation = {"*BS-*"}>} Downtime)/60
Do I have to change the Alternate States of the graphs to <inherited> or something when I do this?
Could you please provide me with some tips on how to use Alternate States in this case?
Thanks in advance
Greets,
Tom
Accepted Solutions
- Mark as New
- Bookmark
- Subscribe
- Mute
- Subscribe to RSS Feed
- Permalink
- Report Inappropriate Content
Hi @tcjwpeeters
Try like below
Sum({[Top1 Selection]}{<Year = $::Year, Month = $::Month,FunctionalLocation = {"*BS-*"}>} Downtime)/60
now, its will reflect for Year & month also. Similiarly, you can change accordingly
FYR:
Please close the thread by marking correct answer & give likes if you like the post.
- Mark as New
- Bookmark
- Subscribe
- Mute
- Subscribe to RSS Feed
- Permalink
- Report Inappropriate Content
Hi MayilVahanan,
Thank you, for Fields like Year etc. this works fine.
But the one parameter which I would require to affect the graphs is "Rayon" in the top-left corner.
Rayon is a selfmade dimension which WildMatches FunctionalLocations.
If I use your formula on FunctionalLocation it doesn't change the graphs when selecting a specific "Rayon";
Sum({[Top1 Selection]}{<FunctionalLocation = $::FunctionalLocation>} Downtime)/60
any thoughts?
- Mark as New
- Bookmark
- Subscribe
- Mute
- Subscribe to RSS Feed
- Permalink
- Report Inappropriate Content
Hi MayilVahanan,
thank you for your solution.
THe existing problem with the selfmade dimension will be solved in the script at our Back-end.
Greets,
Tom
