Unlock a world of possibilities! Login now and discover the exclusive benefits awaiting you.
- Qlik Community
- :
- Forums
- :
- Analytics
- :
- New to Qlik Analytics
- :
- Re: NULL Value
- Subscribe to RSS Feed
- Mark Topic as New
- Mark Topic as Read
- Float this Topic for Current User
- Bookmark
- Subscribe
- Mute
- Printer Friendly Page
- Mark as New
- Bookmark
- Subscribe
- Mute
- Subscribe to RSS Feed
- Permalink
- Report Inappropriate Content
NULL Value
Hello All
Please help me in the below query. I do not know if it is possible or not in Qlik Sense
Please suggest.
In the below attached screen shot,for Bar graph, I have NULL value in the data. I want to use the formula which tells that when there is value it shows the amount and when there is no data it shows the comment that "Data is not available". Just like the Pie-Chart takes default comment.
Formula I used:
IF(len(trim(Department)) > 0, Sum(Amount))
Please suggest.
Thanks
DC
- « Previous Replies
-
- 1
- 2
- Next Replies »
Accepted Solutions
- Mark as New
- Bookmark
- Subscribe
- Mute
- Subscribe to RSS Feed
- Permalink
- Report Inappropriate Content
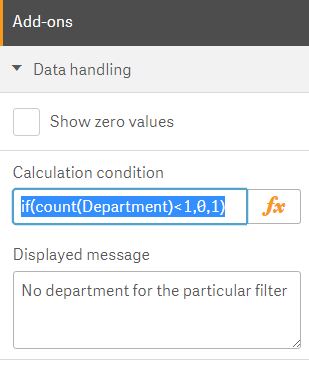
Add Calculation condition and Your custom message as below
If a post helps to resolve your issue, please accept it as a Solution.
- Mark as New
- Bookmark
- Subscribe
- Mute
- Subscribe to RSS Feed
- Permalink
- Report Inappropriate Content
what happens when you remove the condition and do just SUM(Amount)?
try this : SUM({<Department = {*}>} Amount)
If a post helps to resolve your issue, please accept it as a Solution.
- Mark as New
- Bookmark
- Subscribe
- Mute
- Subscribe to RSS Feed
- Permalink
- Report Inappropriate Content
Thanks sir!!
In screenshot visualization, "Bar Graph with out formula" contain only "SUM(Amount)" formula
The above formula which you have given does not work, I am getting the same by un-check the NULL values.
Is there any formula which remove the NULL value and shows the comment
Thanks
DC
- Mark as New
- Bookmark
- Subscribe
- Mute
- Subscribe to RSS Feed
- Permalink
- Report Inappropriate Content
try this
NULLASVALUE Field;
SET NullValue = '- ';
- Mark as New
- Bookmark
- Subscribe
- Mute
- Subscribe to RSS Feed
- Permalink
- Report Inappropriate Content
Try using the Data Handling option(under Add-ons) in the properties panel, this allows you set a calculation condition and a display message to accompany it.
See attached example
Hope this helps
- Mark as New
- Bookmark
- Subscribe
- Mute
- Subscribe to RSS Feed
- Permalink
- Report Inappropriate Content
Yes sir
This is what I want.
But the issue is if I use the above logic it shows the comment for all the Clients
In my dataset there is only some client where the data is null. Please suggest
- Mark as New
- Bookmark
- Subscribe
- Mute
- Subscribe to RSS Feed
- Permalink
- Report Inappropriate Content
Can you share a sample of your dataset?
- Mark as New
- Bookmark
- Subscribe
- Mute
- Subscribe to RSS Feed
- Permalink
- Report Inappropriate Content
Thanks for helping sir!!
Please find the below dummy script of data
Department:
LOAD * INLINE
[
Txtype,Amount,Dates,Client
A,773,42586,DN
A,812,42586,DN
A,649,42586,DN
A,968,42586,DN
A,933,42586,DN
A,804,42586,DN
P,791,42586,DN
P,677,42586,DN
P,763,42586,DN
P,876,42586,DN
P,765,42586,DN
];
Concatenate
LOAD * INLINE
[
Txtype,Amount,Dates,Department,Client
A,773,42586,E,CI
A,812,42586,E,CI
A,649,42586,E,CI
A,968,42586,P,CI
A,933,42586,P,CI
A,804,42586,S,CI
P,791,42586,S,CI
P,677,42586,T,CI
P,763,42586,T,CI
P,876,42586,M,CI
P,765,42586,M,CI
];
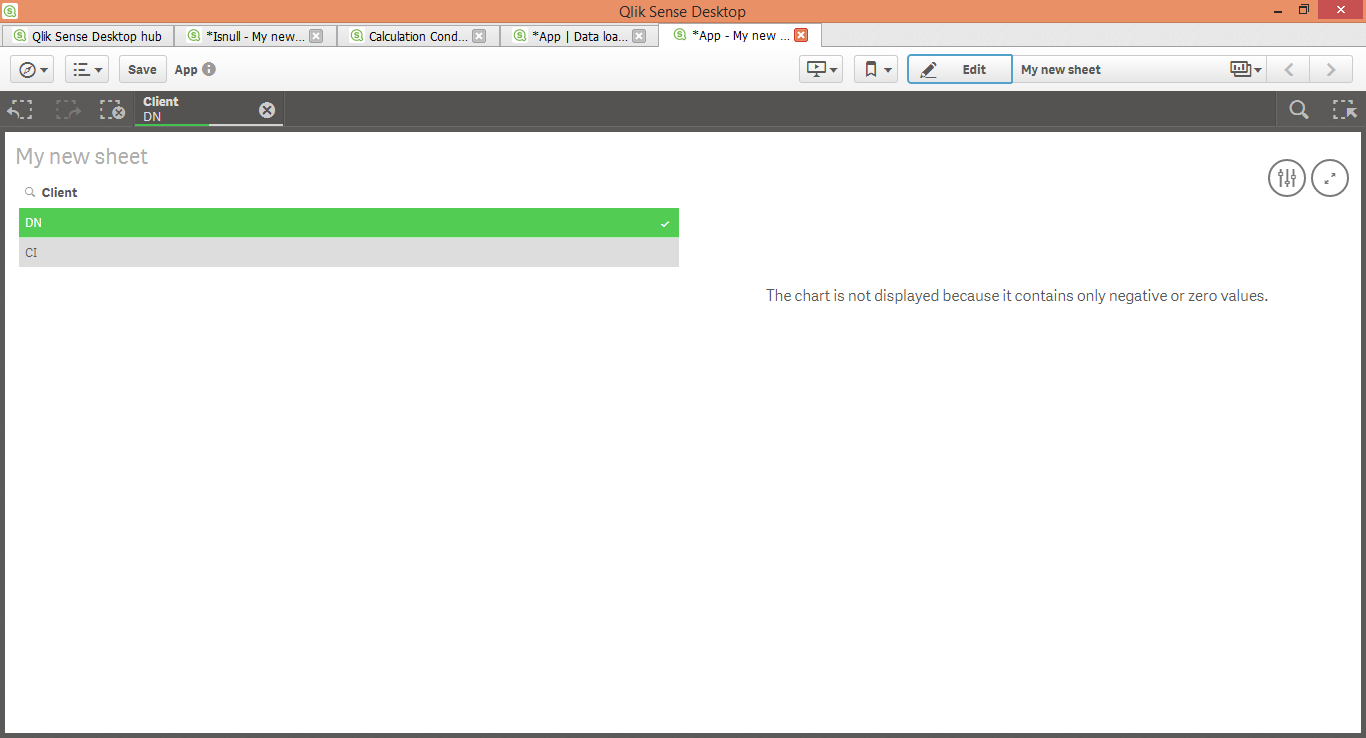
For DI we have no department, I want if we select DI it shows the comment in place of blank line shown in the snapshot
But for CI it will show the data. Please suggest !
Thanks
DC
- Mark as New
- Bookmark
- Subscribe
- Mute
- Subscribe to RSS Feed
- Permalink
- Report Inappropriate Content
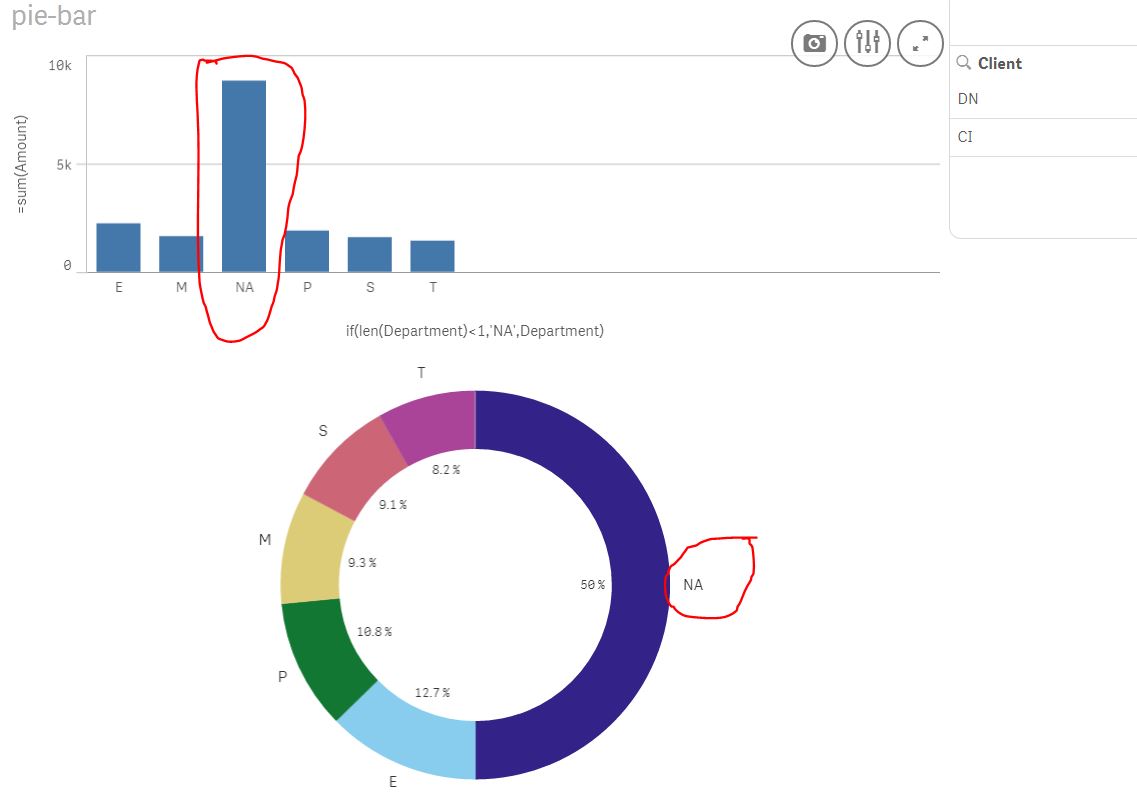
Is this what you are trying to do??
Just add a a calculated field
=if(len(Department)<1,'NA',Department)
If a post helps to resolve your issue, please accept it as a Solution.
- Mark as New
- Bookmark
- Subscribe
- Mute
- Subscribe to RSS Feed
- Permalink
- Report Inappropriate Content
Thanks sir!!
I do not want to show the #n/a in the bar graph.
I want if the person select the Filter "DI", the bar graph shows the comment that "No department for the particular filter"
Just like in Pie-Chart, if there is no data it will show us the comment
- « Previous Replies
-
- 1
- 2
- Next Replies »