Unlock a world of possibilities! Login now and discover the exclusive benefits awaiting you.
- Qlik Community
- :
- Forums
- :
- Analytics
- :
- New to Qlik Analytics
- :
- Need Help in moving column to row
- Subscribe to RSS Feed
- Mark Topic as New
- Mark Topic as Read
- Float this Topic for Current User
- Bookmark
- Subscribe
- Mute
- Printer Friendly Page
- Mark as New
- Bookmark
- Subscribe
- Mute
- Subscribe to RSS Feed
- Permalink
- Report Inappropriate Content
Need Help in moving column to row
Is it possible to convert Row data to single column in Qlik Sense?
Current format:
| BP ID | Year | Quarter | Sales |
| 10001 | 2014 | 1 | 100 |
| 10001 | 2014 | 2 | 110 |
| 10001 | 2014 | 3 | 120 |
| 10001 | 2014 | 4 | 130 |
| 10001 | 2013 | 3 | 90 |
Desired format:
| BP ID | 2013-Q4 | 2014-Q1 | 2014-Q2 | 2014-Q3 | 2014-Q4 |
| 10001 | 90 | 100 | 110 | 120 | 130 |
BTW, desired format is possible via Pivot Table extension, but I need desired format for extract data to excel (if I extract via Pivot extension, I am still getting current format)
Thanks for your help.
Accepted Solutions
- Mark as New
- Bookmark
- Subscribe
- Mute
- Subscribe to RSS Feed
- Permalink
- Report Inappropriate Content
I agree this would be best served through a PIVOT table.
For a data model solution you can consider the 'Generic Load'. Which turns dimension values into fields.
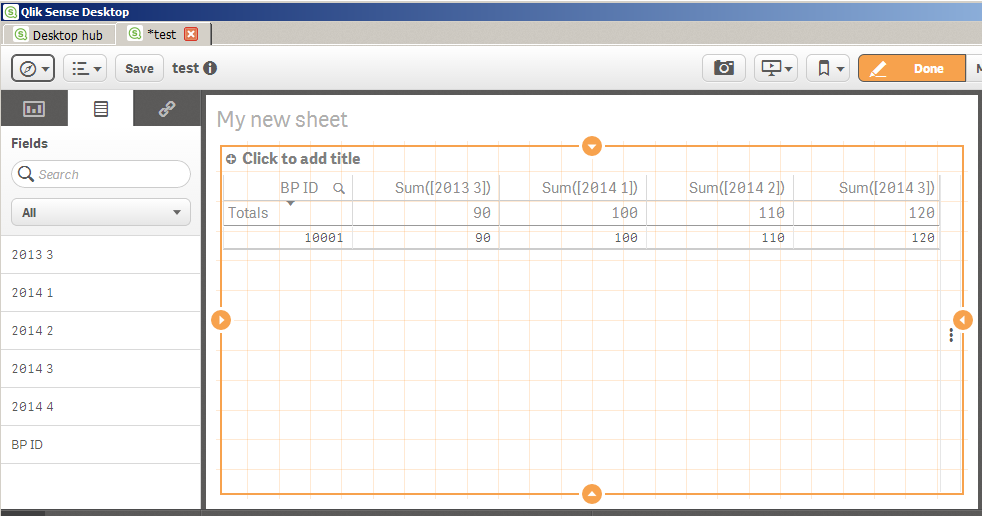
Here is a sample load script using your data and screenshot is an output using a simple table object
generic LOAD
"BP ID",
"Year" & ' ' & Quarter as YearQuarter,
Sales
FROM [lib://community]
(html, codepage is 1252, embedded labels, table is @1);
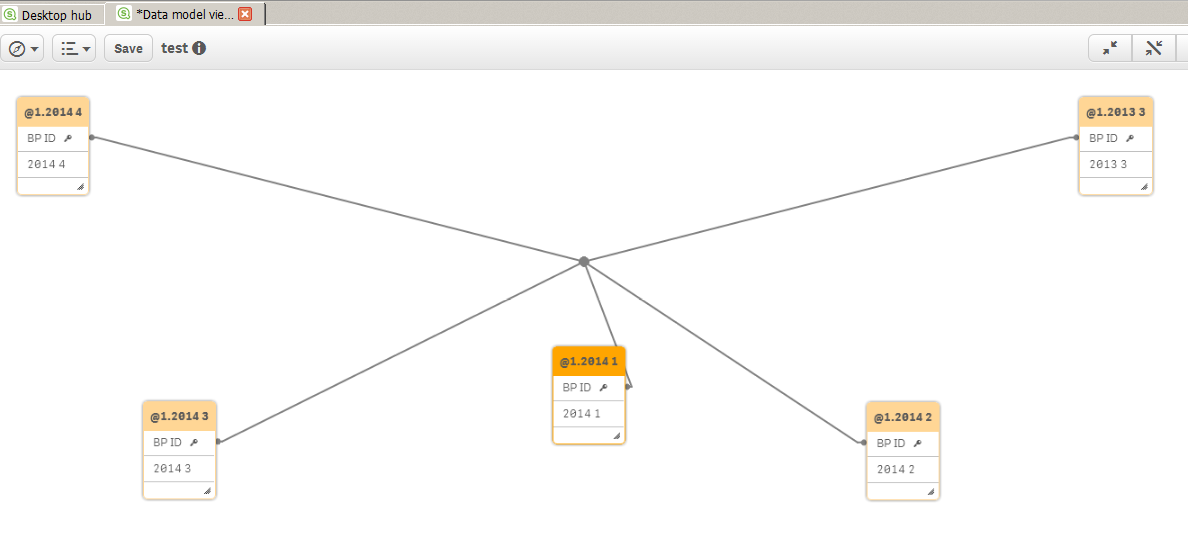
Take note of the funky data model that generic loads create:
- Mark as New
- Bookmark
- Subscribe
- Mute
- Subscribe to RSS Feed
- Permalink
- Report Inappropriate Content
Hi,
Then you have to write separate expressions for each quarter
Script:
LOAD
*,
Year & '-' & 'Q' & Quarter AS YearQuarter;
LOAD
*,
QuarterStart(MakeDate(Year, Quarter*3)) AS Date
FROM DataSource;
Dimension: BP ID
Expression 1.
1. Caption - Only({<Date={'$(=QuarterStart(Max(Date), -4))'}>} YearQuarter)
Expression: Sum({<Date={'$(=QuarterStart(Max(Date), -4))'}>} Sales)
Expression 2.
Caption - Only({<Date={'$(=QuarterStart(Max(Date), -3))'}>} YearQuarter)
Expression: Sum({<Date={'$(=QuarterStart(Max(Date), -3))'}>} Sales)
Expression 3.
Caption - Only({<Date={'$(=QuarterStart(Max(Date), -2))'}>} YearQuarter)
Expression: Sum({<Date={'$(=QuarterStart(Max(Date), -2))'}>} Sales)
Expression 4.
Caption - Only({<Date={'$(=QuarterStart(Max(Date), -1))'}>} YearQuarter)
Expression: Sum({<Date={'$(=QuarterStart(Max(Date), -1))'}>} Sales)
Expression 5.
Caption - Only({<Date={'$(=QuarterStart(Max(Date)))'}>} YearQuarter)
Expression: Sum({<Date={'$(=QuarterStart(Max(Date)))'}>} Sales)
Regards,
Jagan.
- Mark as New
- Bookmark
- Subscribe
- Mute
- Subscribe to RSS Feed
- Permalink
- Report Inappropriate Content
I agree this would be best served through a PIVOT table.
For a data model solution you can consider the 'Generic Load'. Which turns dimension values into fields.
Here is a sample load script using your data and screenshot is an output using a simple table object
generic LOAD
"BP ID",
"Year" & ' ' & Quarter as YearQuarter,
Sales
FROM [lib://community]
(html, codepage is 1252, embedded labels, table is @1);
Take note of the funky data model that generic loads create: