Unlock a world of possibilities! Login now and discover the exclusive benefits awaiting you.
- Qlik Community
- :
- Forums
- :
- Analytics
- :
- New to Qlik Analytics
- :
- Re: Need chart in below format
- Subscribe to RSS Feed
- Mark Topic as New
- Mark Topic as Read
- Float this Topic for Current User
- Bookmark
- Subscribe
- Mute
- Printer Friendly Page
- Mark as New
- Bookmark
- Subscribe
- Mute
- Subscribe to RSS Feed
- Permalink
- Report Inappropriate Content
Need chart in below format
Hi All,
We have data in a table as below
| File | Week1 | week2 | week3 | week4 |
| File1 | 10 | 20 | 30 | 410 |
| File2 | 10 | 410 | ||
| File3 | 10 | 20 | 30 | 90 |
| File4 | 10 | 20 | 30 | 80 |
| File5 | 20 | 30 | 30 | 41 |
| File6 | 10 | 20 | 30 | 70 |
| File7 | 10 | 88 | 30 | 31 |
| File8 | 10 | 20 | 30 | 410 |
| File9 | 22 | 20 | 10 | 40 |
| File10 | 33 | 55 | 30 | 50 |
| File11 | 10 | 67 | 30 | 54 |
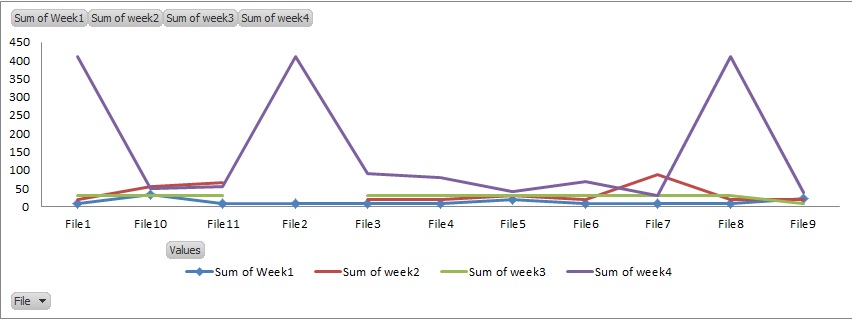
By default when we add File as Dimension and Week1,2,3 and 4 as Measures we get the Chart with File name in X axis and Week Measure in Y axis, as below.
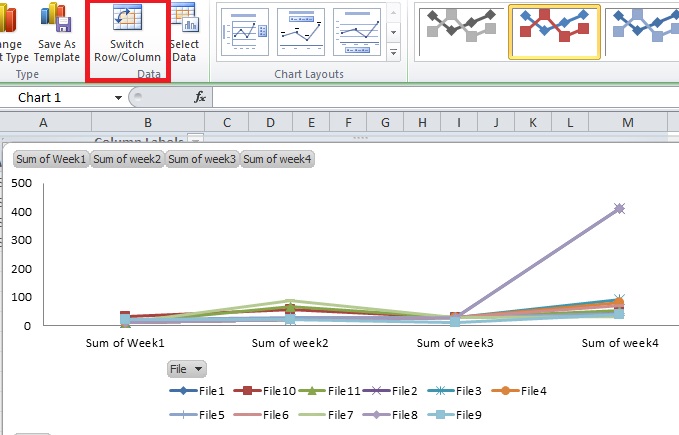
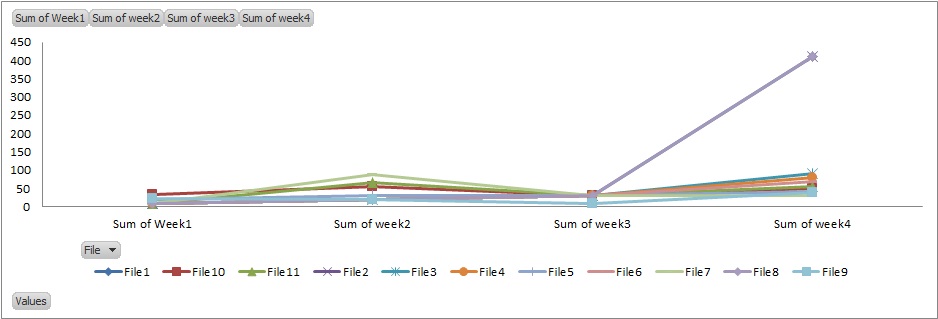
Instead we need Lables (i.e. Week1,2,3 and 4) in X axis instead of values as diplayed below.

In QlikView do we have any option such as Swap rows and coulmn of chart like in excel as hilighted. If not is there any other tricks to get the same?
Thanks,
Puratchi Vendan
- Tags:
- chart_formatting
- Mark as New
- Bookmark
- Subscribe
- Mute
- Subscribe to RSS Feed
- Permalink
- Report Inappropriate Content
Hi Puratchi,
Something like this:

Have you tried using the CROSSTABLE verb as in:
crosstable(Week1,Measure1)
Load * Inline [
File,week1,week2,week3,week4
File1,10,20,30,410
File2,10,410
File3,10,20,30,90
File4,10,20,30,80
File5,20,30,30,41
File6,10,20,30,70
File7,10,88,30,31
File8,10,20,30,410
File9,22,20,10,40
File10,33,55,30,50
File11,10,67,30,54
];
See attached .qvf
Copy to C:\Users\<user profile>\Documents\Qlik\Sense\Apps and refresh with F5.
Also take a look at: Power of Qlik Script - Reshaping Data with Crosstable (video) parts 1 to 3
found in:
Please mark the appropriate replies as CORRECT / HELPFUL so our team and other members know that your question(s) has been answered to your satisfaction.
Let me know how you do.
Regards,
Mike Tarallo
Qlik
Mike Tarallo
Qlik
- Mark as New
- Bookmark
- Subscribe
- Mute
- Subscribe to RSS Feed
- Permalink
- Report Inappropriate Content
Hi Mike,
Thanks for prompt reponse.
We have data in database table. we cannot hardcode as inline. The graph which displayed i guess it must be from QlikSense and not QlikView. We need the graph in QlikView. And moreover i could see that it has only one line instead of multi lines for each file.
Our Database table has
Dimension Column - as - File
Measure Columns -as - Week1 Week2 Week3 Week4
Requirement
In - Line Chart
We want seperate line for each files that we receive, sub divided by week. So instead of X axis divided by week value we need header of the week on the x-axis.
We did the similar on Tableau (since it had column and row swap option) and we got that. But our requirement is to get the same on QlikView.
Y- axis -------- File
X- axis (Text over the axis)------- Header of Week1, week2 week 3 and week4
Seperate lines for each file in different color as below.
Thanks,
Puratchi Vendan
- Mark as New
- Bookmark
- Subscribe
- Mute
- Subscribe to RSS Feed
- Permalink
- Report Inappropriate Content
Hi,
You can replace that piece of code with your actual select query.
crosstable(Week1,Measure1)
SELECT
*
FROM TableName;
Add File and Week as dimensions, so that you will get line for each File.
Hope this helps you.
Regards,
Jagan.
- Mark as New
- Bookmark
- Subscribe
- Mute
- Subscribe to RSS Feed
- Permalink
- Report Inappropriate Content
Hi Puratchi - I was not aware if you knew how data is access in Qlik products - the INLINE was a way for me to use sample data - you can access data from the source using a variety of connectors. Please note that you posted in the Qlik Sense forums not QlikView. I will move this discussion over to that location.
The same goes for QlikView - all you need to do is add over the File field as another dimension - see attached .qvw for the QlikView sample.
Please mark the appropriate replies as CORRECT / HELPFUL so our team and other members know that your question(s) has been answered to your satisfaction.
Regards,
Mike Tarallo
Qlik

Mike Tarallo
Qlik