Unlock a world of possibilities! Login now and discover the exclusive benefits awaiting you.
- Qlik Community
- :
- Forums
- :
- Analytics
- :
- New to Qlik Analytics
- :
- Re: New line character in qlik sense, chr(10) and ...
- Subscribe to RSS Feed
- Mark Topic as New
- Mark Topic as Read
- Float this Topic for Current User
- Bookmark
- Subscribe
- Mute
- Printer Friendly Page
- Mark as New
- Bookmark
- Subscribe
- Mute
- Subscribe to RSS Feed
- Permalink
- Report Inappropriate Content
New line character in qlik sense, chr(10) and chr(13) does not work
Hi
I want to get a new line character in a text box (#1 KPI). chr(10) and chr(13) does not work. How do we do that?
- « Previous Replies
-
- 1
- 2
- Next Replies »
- Mark as New
- Bookmark
- Subscribe
- Mute
- Subscribe to RSS Feed
- Permalink
- Report Inappropriate Content
Due to the responsive nature of the charts it wouldn't make sense to force a break.
If you want to separate chart context make use of the Title, subtitle and footnote fields.
- Mark as New
- Bookmark
- Subscribe
- Mute
- Subscribe to RSS Feed
- Permalink
- Report Inappropriate Content
Thanks Andy! I however need to display two different metrics on a single text object in two different lines? Is there a way we can do this? Do we have some alternatives may be?
- Mark as New
- Bookmark
- Subscribe
- Mute
- Subscribe to RSS Feed
- Permalink
- Report Inappropriate Content
I wouldn't say it doesn't make sense to force a line break even with responsive design, since a line break does help readers.
Most word processors allow line breaks etc. independent from the page layout.
To me, it seems more like a limitation of the KPI object expression evaluation to me.
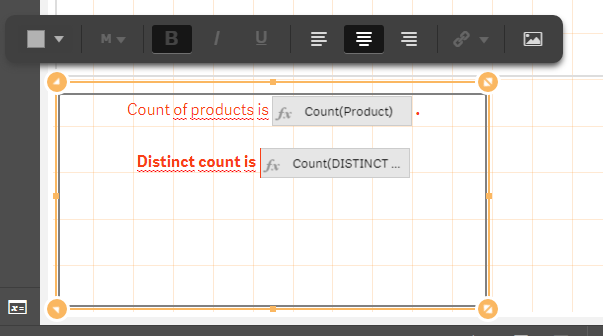
Note that you can use measures in combination with text in a text object (and here you can use line breaks using the text editor).

- Mark as New
- Bookmark
- Subscribe
- Mute
- Subscribe to RSS Feed
- Permalink
- Report Inappropriate Content
If you mock up what you are looking to do we can help you better.
- Mark as New
- Bookmark
- Subscribe
- Mute
- Subscribe to RSS Feed
- Permalink
- Report Inappropriate Content
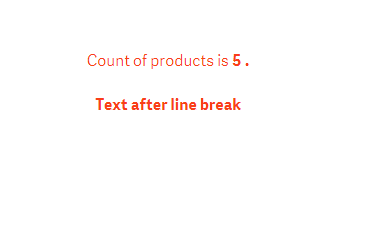
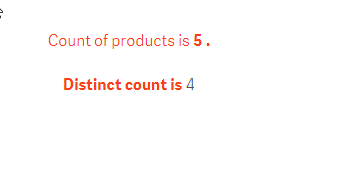
A text object does support multiple expressions, and line breaks:


- Mark as New
- Bookmark
- Subscribe
- Mute
- Subscribe to RSS Feed
- Permalink
- Report Inappropriate Content
Thanks Stefan! The text object had limitation of background color and hence I used the KPI object. Here is what I want to do:
1. count of two fields something like count({<[dim1]={'text1'}>}NAME) & <add a new line> & sum({<[dim1]={'text1'}>}[sales])
2. I also want to change the background colors of the box
3. Center aligned the above
- Mark as New
- Bookmark
- Subscribe
- Mute
- Subscribe to RSS Feed
- Permalink
- Report Inappropriate Content
Maybe look into using an extension, e.g. have a look at
- Mark as New
- Bookmark
- Subscribe
- Mute
- Subscribe to RSS Feed
- Permalink
- Report Inappropriate Content
Thanks Stefan! I will try the extn. However I wanted a native solution if possible. Looks like there isn't.
- Mark as New
- Bookmark
- Subscribe
- Mute
- Subscribe to RSS Feed
- Permalink
- Report Inappropriate Content
I am agree it 's a limitation,
- « Previous Replies
-
- 1
- 2
- Next Replies »