Unlock a world of possibilities! Login now and discover the exclusive benefits awaiting you.
- Qlik Community
- :
- Forums
- :
- Analytics
- :
- New to Qlik Analytics
- :
- Re: Newbie question: how to preserve dimension val...
- Subscribe to RSS Feed
- Mark Topic as New
- Mark Topic as Read
- Float this Topic for Current User
- Bookmark
- Subscribe
- Mute
- Printer Friendly Page
- Mark as New
- Bookmark
- Subscribe
- Mute
- Subscribe to RSS Feed
- Permalink
- Report Inappropriate Content
Newbie question: how to preserve dimension values when filtering
Good Morning,
sometimes I get stuck into a simple problem, without reach out a solution...
I have a table like this:
Customer Month Revenue
A Jan 100
A Feb 100
B Jan 100
C Jan 100
D Jan 100
D Feb 100
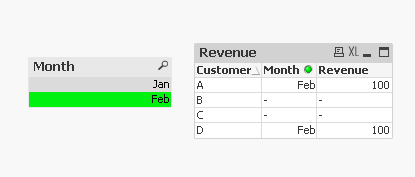
Of course if I select "Feb" as month I get:
Customer Month Revenue
A Feb 100
D Feb 100
But I'd like to have this:
Customer Month Revenue
A Feb 100
B <null> <null>
C <null> <null>
D Feb 100
In other words, I'd like to have customers always shown, even they haven't revenue for that month.
Any suggestion ?
Thanks in advance.
Paolo.
- Mark as New
- Bookmark
- Subscribe
- Mute
- Subscribe to RSS Feed
- Permalink
- Report Inappropriate Content
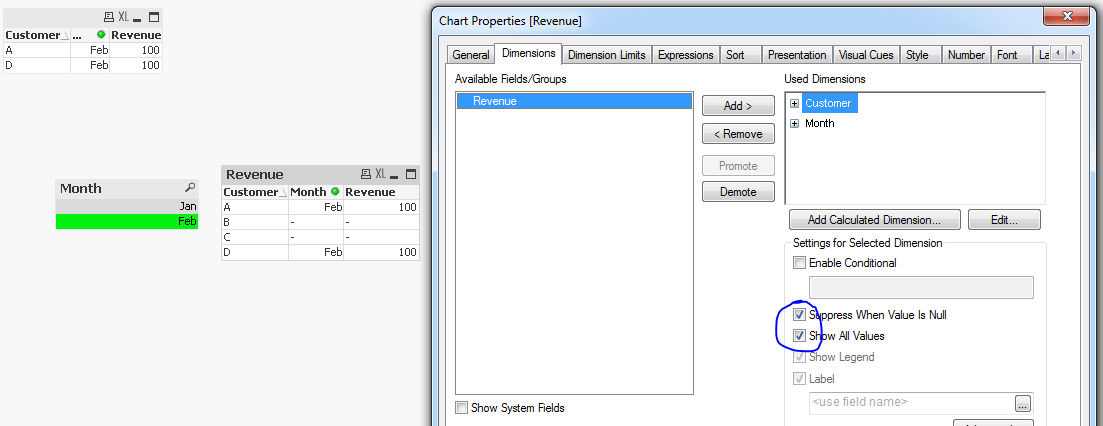
May be this:
Settings needed
1) Dimension tab
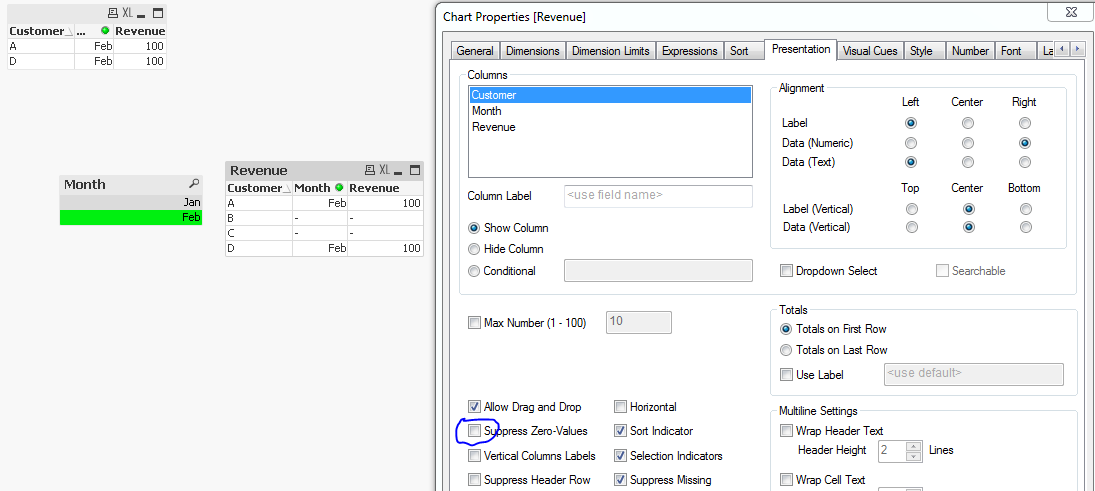
2) Presentation tab
- Mark as New
- Bookmark
- Subscribe
- Mute
- Subscribe to RSS Feed
- Permalink
- Report Inappropriate Content
Hi Paolo,
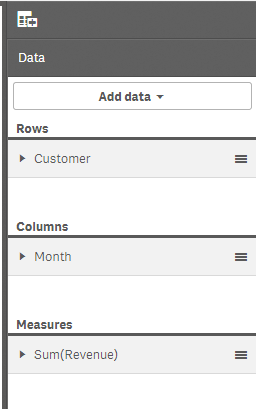
will Pivot Table chart like below work for you?
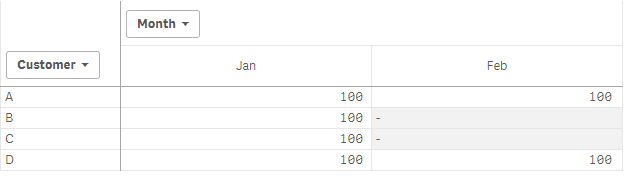
Below is the setting for the pivot table above.
- Mark as New
- Bookmark
- Subscribe
- Mute
- Subscribe to RSS Feed
- Permalink
- Report Inappropriate Content
Err, that's qlikview  I think it's a QlikSense question
- Mark as New
- Bookmark
- Subscribe
- Mute
- Subscribe to RSS Feed
- Permalink
- Report Inappropriate Content
My bad, I tend to not look at that after I have already posted my response. Need to keep an eye on this to make sure I post responses which are helpful.
- Mark as New
- Bookmark
- Subscribe
- Mute
- Subscribe to RSS Feed
- Permalink
- Report Inappropriate Content
in your expression definition add set analysis to ignore the selection made. I.e
sum({<[Month]=>} sales)
this technique is useful to brush just to highlighted selected dims.
- Mark as New
- Bookmark
- Subscribe
- Mute
- Subscribe to RSS Feed
- Permalink
- Report Inappropriate Content
Hey Sunny, your posts are always helpful, I'm just having a bit of fun there have a great day.
- Mark as New
- Bookmark
- Subscribe
- Mute
- Subscribe to RSS Feed
- Permalink
- Report Inappropriate Content
Maybe have a look into what Henric shows here:
QlikSense Dimension: show all values like QlikView?
With more than 1 dimension, this probably won't really work well (looking at your requested outcome).