Unlock a world of possibilities! Login now and discover the exclusive benefits awaiting you.
- Qlik Community
- :
- Forums
- :
- Analytics
- :
- New to Qlik Analytics
- :
- Subscribe to RSS Feed
- Mark Topic as New
- Mark Topic as Read
- Float this Topic for Current User
- Bookmark
- Subscribe
- Mute
- Printer Friendly Page
- Mark as New
- Bookmark
- Subscribe
- Mute
- Subscribe to RSS Feed
- Permalink
- Report Inappropriate Content
PDF
Hello together,
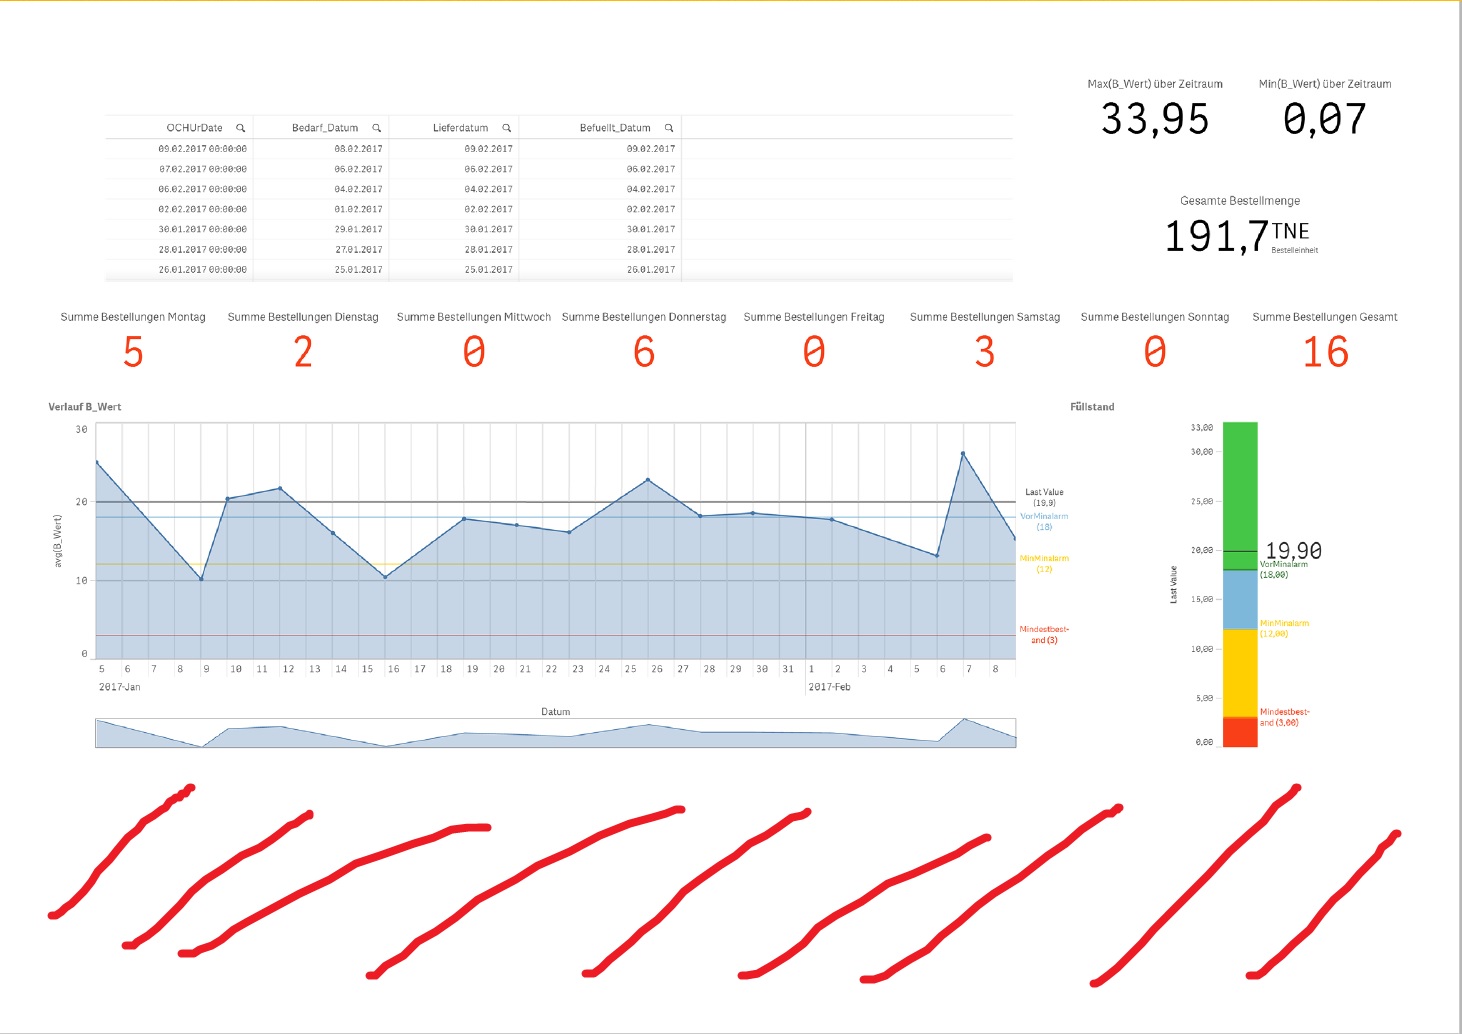
if I create a new PDF file in Qlik Sense I get the following result.
Now I have two questions.
1. I set 3 filters and in the PDF I can't see them. How I can obviously them in the PDF?
2. I marked with red unter my Line diagramme the empty space. If I create the diagrammes in Qlik I have no more space in the view, but in the PDF it's look like more place for diagrammes. How I can use the empty space?

- Mark as New
- Bookmark
- Subscribe
- Mute
- Subscribe to RSS Feed
- Permalink
- Report Inappropriate Content
Are you outputting the report from a story?
If you want to include the filtered perhaps add text objects to your Qlik App that display them and then include in your story.
For published reports on filters and schedule you might want to look at NPrinting.
Regards
Andy
- Mark as New
- Bookmark
- Subscribe
- Mute
- Subscribe to RSS Feed
- Permalink
- Report Inappropriate Content
yes the report is outputting from a story
- Mark as New
- Bookmark
- Subscribe
- Mute
- Subscribe to RSS Feed
- Permalink
- Report Inappropriate Content
Are you bringing a whole sheet into the story or individual snapshots of report objects. If you bring in individual snapshots of objects you have more control of their placement and layout.
Bare in mind the Qlik App is a responsive platform and the layout reflects this. pdf is obviously fixed width and so you need to take that into account when setting out your story sheets.
- Mark as New
- Bookmark
- Subscribe
- Mute
- Subscribe to RSS Feed
- Permalink
- Report Inappropriate Content
It's a whole sheet not an individual snapshot. I need a whole sheet for a prasentation, not an individual snapshot.
Your help with the text object wasn't successful.
- Mark as New
- Bookmark
- Subscribe
- Mute
- Subscribe to RSS Feed
- Permalink
- Report Inappropriate Content
ok so as I say if you want more control over your presentation layout you will need to do more than just copy the whole sheet in.
You will need to layout the invidual objects to make it look better in PDF format.
Perhaps instead of a text object you have a table with one column or filter box to show your filtered values.