Unlock a world of possibilities! Login now and discover the exclusive benefits awaiting you.
- Qlik Community
- :
- Forums
- :
- Analytics
- :
- New to Qlik Analytics
- :
- Percentage and Number value on Bar and Stacked Cha...
- Subscribe to RSS Feed
- Mark Topic as New
- Mark Topic as Read
- Float this Topic for Current User
- Bookmark
- Subscribe
- Mute
- Printer Friendly Page
- Mark as New
- Bookmark
- Subscribe
- Mute
- Subscribe to RSS Feed
- Permalink
- Report Inappropriate Content
Percentage and Number value on Bar and Stacked Chart
Hi Qlik Community ![]()
I need help on this so much.
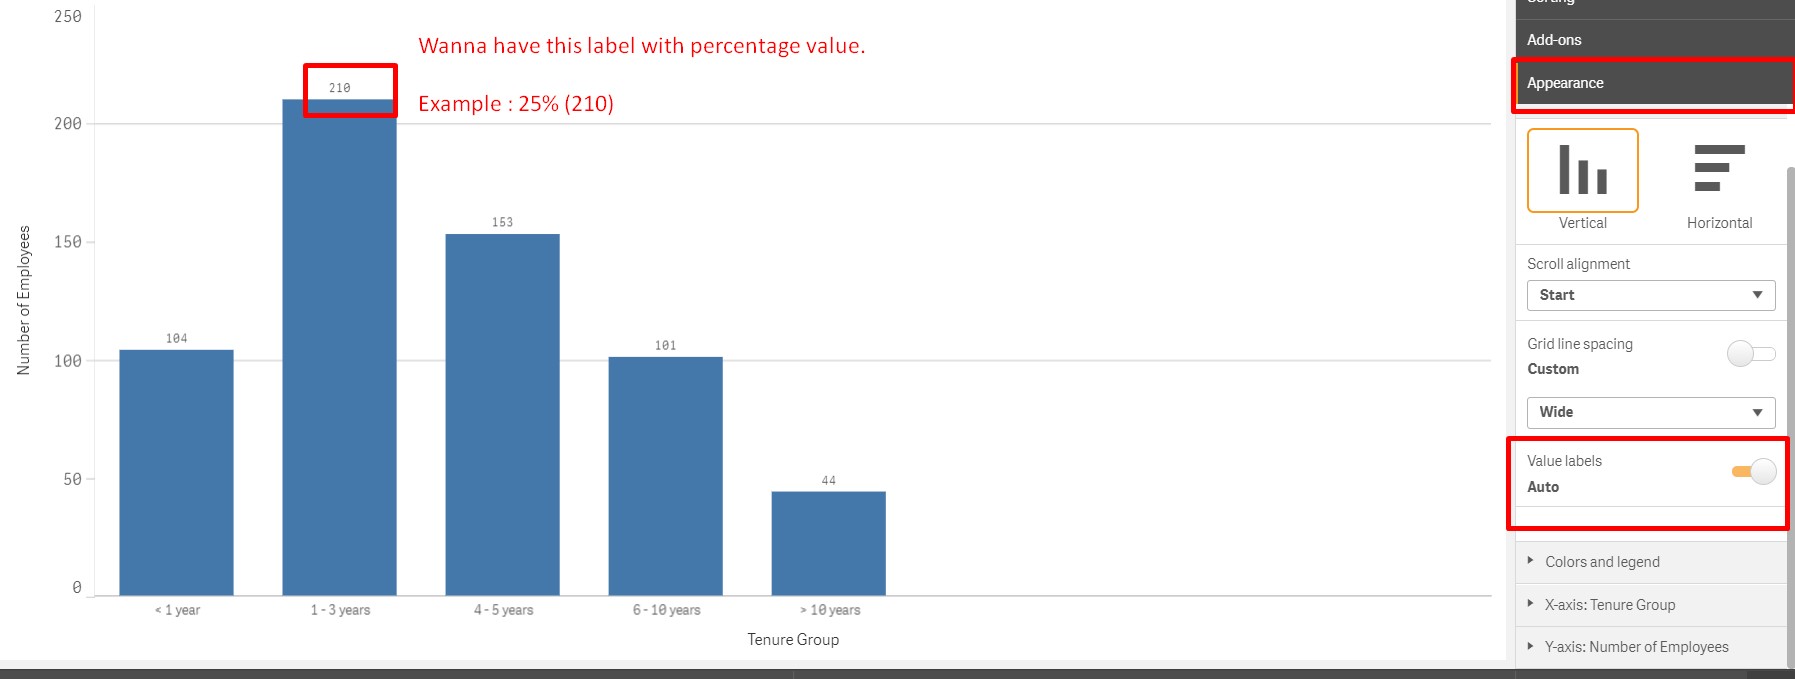
I would like to know how we can add percentage and number value together in labels.
I used the appearance button in Qlik Sense. But, it just for number value.
How I can add percentage value together with it?

How can I add the percentage and number value for each bar in stacked chart ?

Thanks so much everyone for the help.
Accepted Solutions
- Mark as New
- Bookmark
- Subscribe
- Mute
- Subscribe to RSS Feed
- Permalink
- Report Inappropriate Content
Hi everyone ![]()
Thanks so much for helping me out.
I got to know and learnt new things from all the answers.
I didn't use this chart anymore since the user wanna have something else.
Hope in future this thread would be helpful and beneficial for others.
Thank You.
- Mark as New
- Bookmark
- Subscribe
- Mute
- Subscribe to RSS Feed
- Permalink
- Report Inappropriate Content
Dont believe it is available by default. i think you need extensions for this.
- Mark as New
- Bookmark
- Subscribe
- Mute
- Subscribe to RSS Feed
- Permalink
- Report Inappropriate Content
You cannot exactly show both numbers and % in single expression
But in mouse hover over you can show both values...
Example:
In your Measure label
'Year = ' & Expression1 & chr(10) &
'% Value = ' & Expression2 & chr(10)
- Mark as New
- Bookmark
- Subscribe
- Mute
- Subscribe to RSS Feed
- Permalink
- Report Inappropriate Content
what u can do is adding one of the measure besides the dimension: sthing like:
as dim : urDim & aggr(sum(YourMeasure),urDim)
as measure: the % measure
- Mark as New
- Bookmark
- Subscribe
- Mute
- Subscribe to RSS Feed
- Permalink
- Report Inappropriate Content
- Mark as New
- Bookmark
- Subscribe
- Mute
- Subscribe to RSS Feed
- Permalink
- Report Inappropriate Content
Hi everyone ![]()
Thanks so much for helping me out.
I got to know and learnt new things from all the answers.
I didn't use this chart anymore since the user wanna have something else.
Hope in future this thread would be helpful and beneficial for others.
Thank You.
