Unlock a world of possibilities! Login now and discover the exclusive benefits awaiting you.
- Qlik Community
- :
- Forums
- :
- Analytics
- :
- New to Qlik Analytics
- :
- Percentage and Values in Pivot Table
- Subscribe to RSS Feed
- Mark Topic as New
- Mark Topic as Read
- Float this Topic for Current User
- Bookmark
- Subscribe
- Mute
- Printer Friendly Page
- Mark as New
- Bookmark
- Subscribe
- Mute
- Subscribe to RSS Feed
- Permalink
- Report Inappropriate Content
Percentage and Values in Pivot Table
Hi,
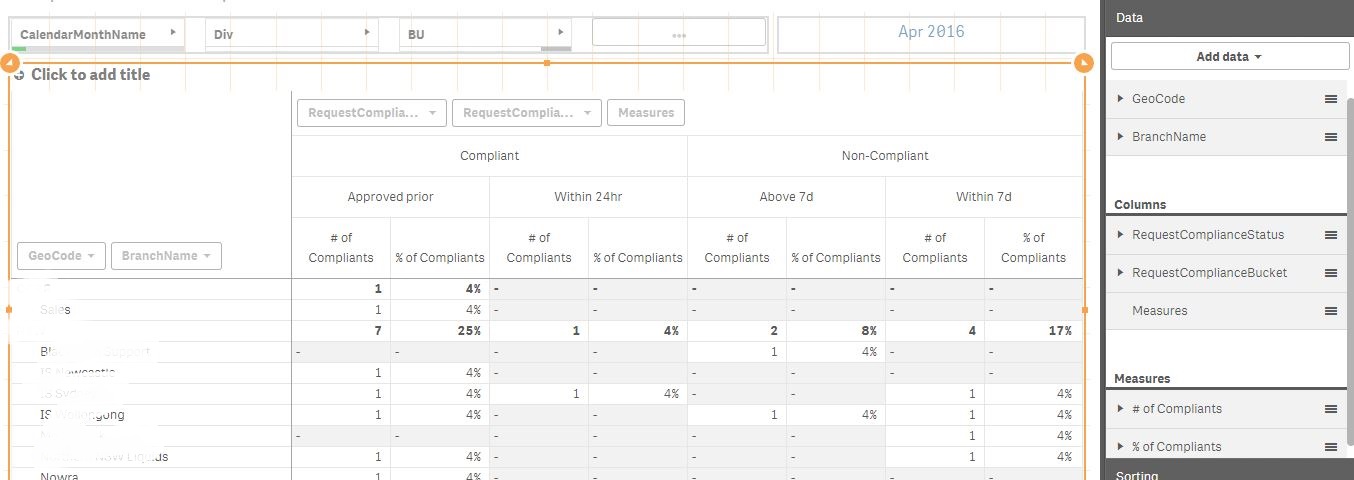
Can any one please help me, how to create a column with % as shown in the attachment.
I'm not able to create % of Compliant and % of Non-Complaint
Logic for Compliant and Non-Compliant
% of Compliant = Compliant total / (Compliant total + Non-Compliant total)
% of Non-Compliant = Non-Compliant total / (Compliant total + Non-Compliant total).
When I create a new expression, it applies to all other measures and dimensions.
I looking to replicate the same thing in qlik sense.
Thanks in Advance.
Regards
Arjun.
- Mark as New
- Bookmark
- Subscribe
- Mute
- Subscribe to RSS Feed
- Permalink
- Report Inappropriate Content
It depends on what your data looks like, and which dimensions you use in the chart...
If you have a field "IsCompliant" that can be True/False, and you want to count an "ID", then you could use the following:
Compliant: Count(distinct {$<IsCompliant={-1}>} ID)
Non-Compliant: Count(distinct {$<IsCompliant={0}>} ID)
Compliant %: Count(distinct {$<IsCompliant={-1}>} ID) / Count(distinct ID)
Non-Compliant %: Count(distinct {$<IsCompliant={0}>} ID) / Count(distinct ID)
HIC
- Mark as New
- Bookmark
- Subscribe
- Mute
- Subscribe to RSS Feed
- Permalink
- Report Inappropriate Content
... and if you use the field "IsCompliant" as dimension in your chart, you could use
Count: Count(distinct ID)
Count %: Count(distinct ID) / Count(distinct total <IsCompliant> ID)
HIC
- Mark as New
- Bookmark
- Subscribe
- Mute
- Subscribe to RSS Feed
- Permalink
- Report Inappropriate Content
Hi Henric,
Apologies for the delay response.
In the presentation, I'm taking multiple dimensions.
If I give one expression its working fine (value), but when I add one more expression (percentage).
It applies the % expression to all the dimensions.
Kindly find the attached image for your reference.
Thanks in Advance.
Regards,
Arjun.