Unlock a world of possibilities! Login now and discover the exclusive benefits awaiting you.
- Qlik Community
- :
- Forums
- :
- Analytics
- :
- New to Qlik Analytics
- :
- Percentages of increments in pivot tables with cal...
- Subscribe to RSS Feed
- Mark Topic as New
- Mark Topic as Read
- Float this Topic for Current User
- Bookmark
- Subscribe
- Mute
- Printer Friendly Page
- Mark as New
- Bookmark
- Subscribe
- Mute
- Subscribe to RSS Feed
- Permalink
- Report Inappropriate Content
Percentages of increments in pivot tables with calculated dimensions
I want to calulate percentage increases in a pivot table. However, the dimension is a calculated one, based on dates entered through 6 boxes of variable extension. I attach a reproducible file for Qlik Sense as an example.
I have 3 measures: Sum(Sales) as Sales, num(Count(Distinct [[Customer ID]),'#,##0',',' ) as UABs (acronym for Unique Active Buyers), and num((Sum(Profit)/Sum(Sales))*100,'0.00') &'%' as Benefits. I want to calculate the percentage of change of these metrics between 3 different periods: "Before Promotion" as "Before", "During Promotion" as "During", and "After Promotion" as "After".
Right now my report looks the following way:
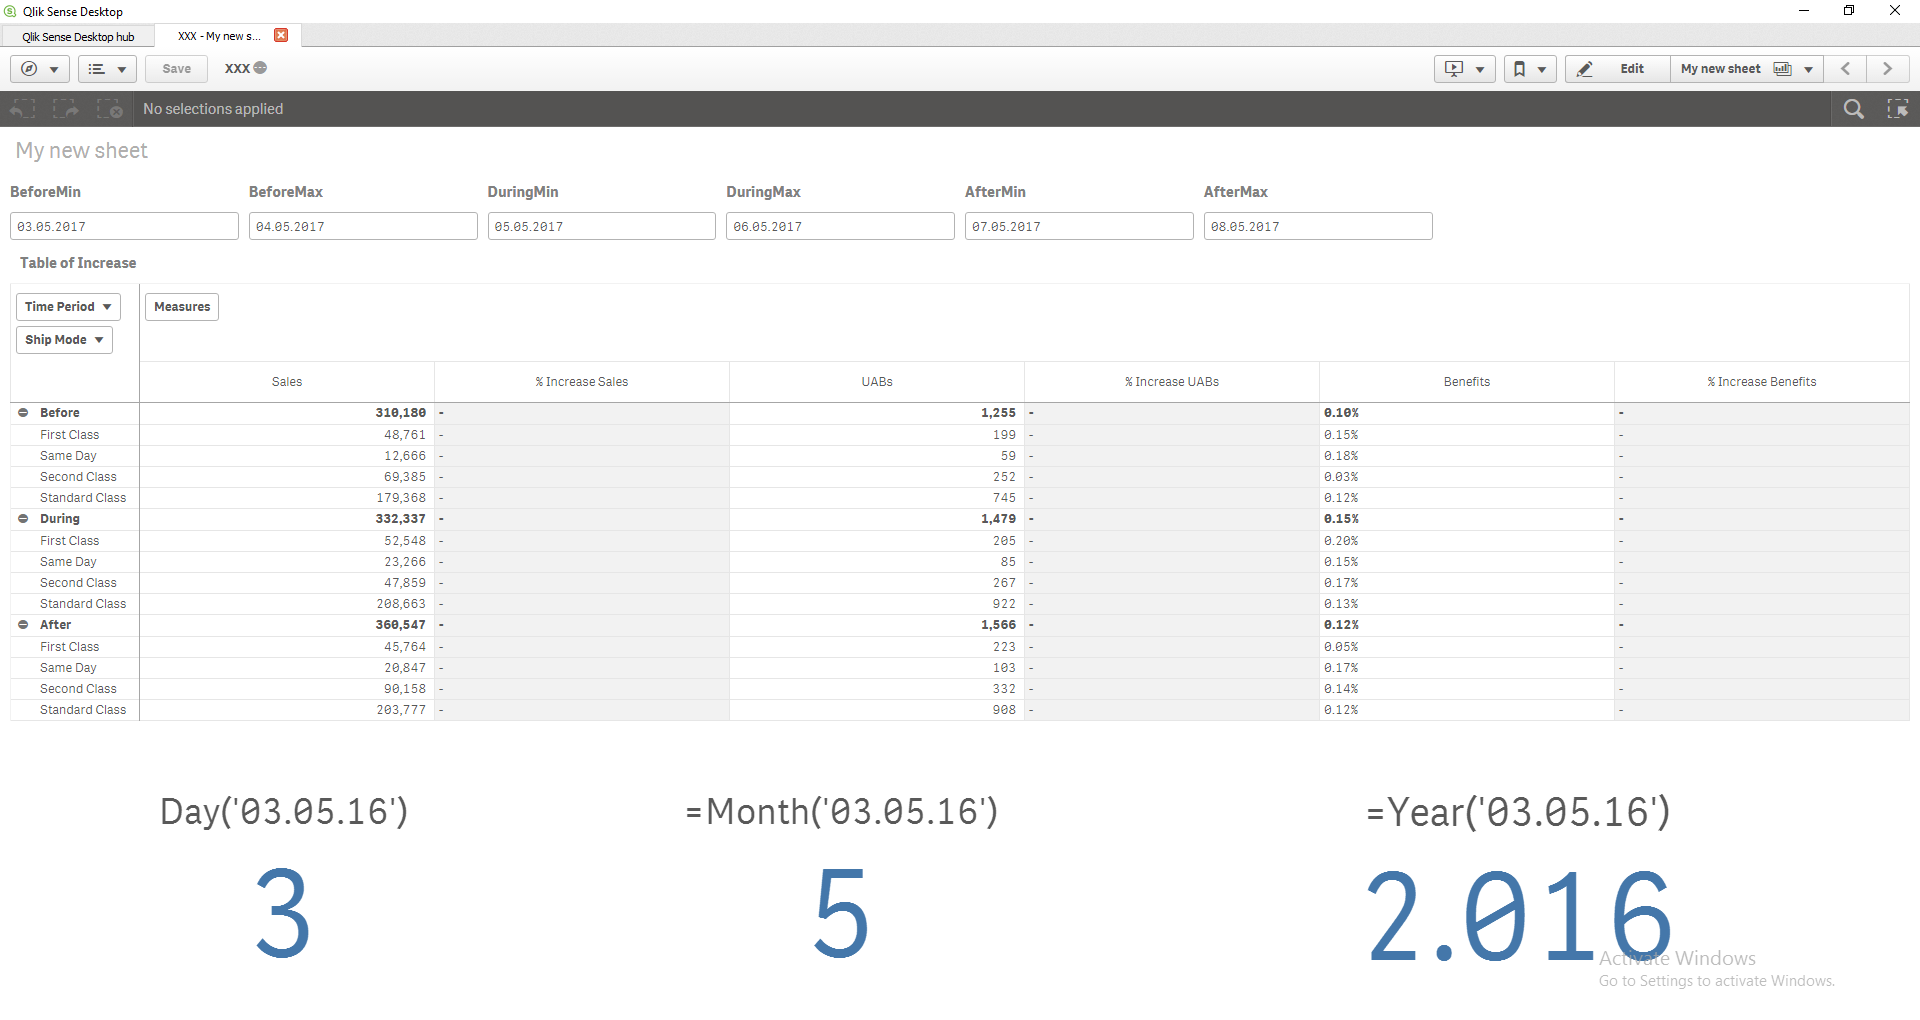
Nevertheless, I would like to have something like in the following screen caption:

Which means that the fields in:
- Before, have been calculated with the variation from Before to After (1st one and the 3rd one).
- During, have been calcultaed with the variation from Before to During (1st and 2nd).
- After, have been calculated with the variation from During to After (2nd and 3rd).
Sales and UAPs % Increase fields are calculated with the percentage formula: {([Final Value] / [Initial Value]) - 1} * 100.
Nevertheless, the Benefits increase field is calculated with a simple difference: [Final Vale] - [Initital Value], given that the values are in the same percentage units.
I appreciate beforehand any help on this specific case. Anibal
P.D. My results are 100% reproducible entering the following values in the 6 "Variable Extension" boxes:
BeforeMin = 03.10.17
BeforeMax = 04.10.17
DuringMin = 05.10.17
DuringMax = 06.10.17
AfterMin = 07.10.17
AfterMax = 08.10.17
- Mark as New
- Bookmark
- Subscribe
- Mute
- Subscribe to RSS Feed
- Permalink
- Report Inappropriate Content
The values in your field Date go from 01.05.17 to 08.05.17 [i.e. all in month 5, May]
Whereas the values you enter for your variables go from 03.10.17 to 08.10.2017 [i.e. all in month 10, Oct]
It also looks as if your data field Date is a string and not a numeric Qlik date.
The Calculated Dimension contains things like :
if( (Date>=Date(Date#('$(vBDA_1)','DD.MM.YY'),'DD.MM.YY'))
So :
- Date is a string
- Date(Date#('$(vBDA_1)','DD.MM.YY'),'DD.MM.YY')) is a numeric Qlik date
This is all most confusing.
Maybe when you load the data from [lib://BI RESOURCES/SAMPLE DATA SET.xlsx] you should convert field Date into a numeric Qlik date.
Whilst this does not answer your actual question in the slightest, I do think the Date field needs sorting before you can progress and then maybe post a revised sample qvf.
- Mark as New
- Bookmark
- Subscribe
- Mute
- Subscribe to RSS Feed
- Permalink
- Report Inappropriate Content
Hi Bill. Thank you for your reply. I will go through your comments and suggestions:
"The values in your field Date go from 01.05.17 to 08.05.17 [i.e. all in month 5, May]. Whereas the values you enter for your variables go from 03.10.17 to 08.10.2017 [i.e. all in month 10, Oct]"
Yes. My idea is creating an interactive report. No matter what dates you enter through the 6 Variable Extension boxes, the pivot table will calculate the increases of the correspondent measures (Sales, UABs, Benefits), considering the registries that fall into these 3 categories: "Before","During", and "After". The dates that the user specify through the boxes don´t need to cover the entire Date window of the Data Set.
"It also looks as if your data field Date is a string and not a numeric Qlik date. [...]. Maybe when you load the data from [lib://BI RESOURCES/SAMPLE DATA SET.xlsx] you should convert field Date into a numeric Qlik date."
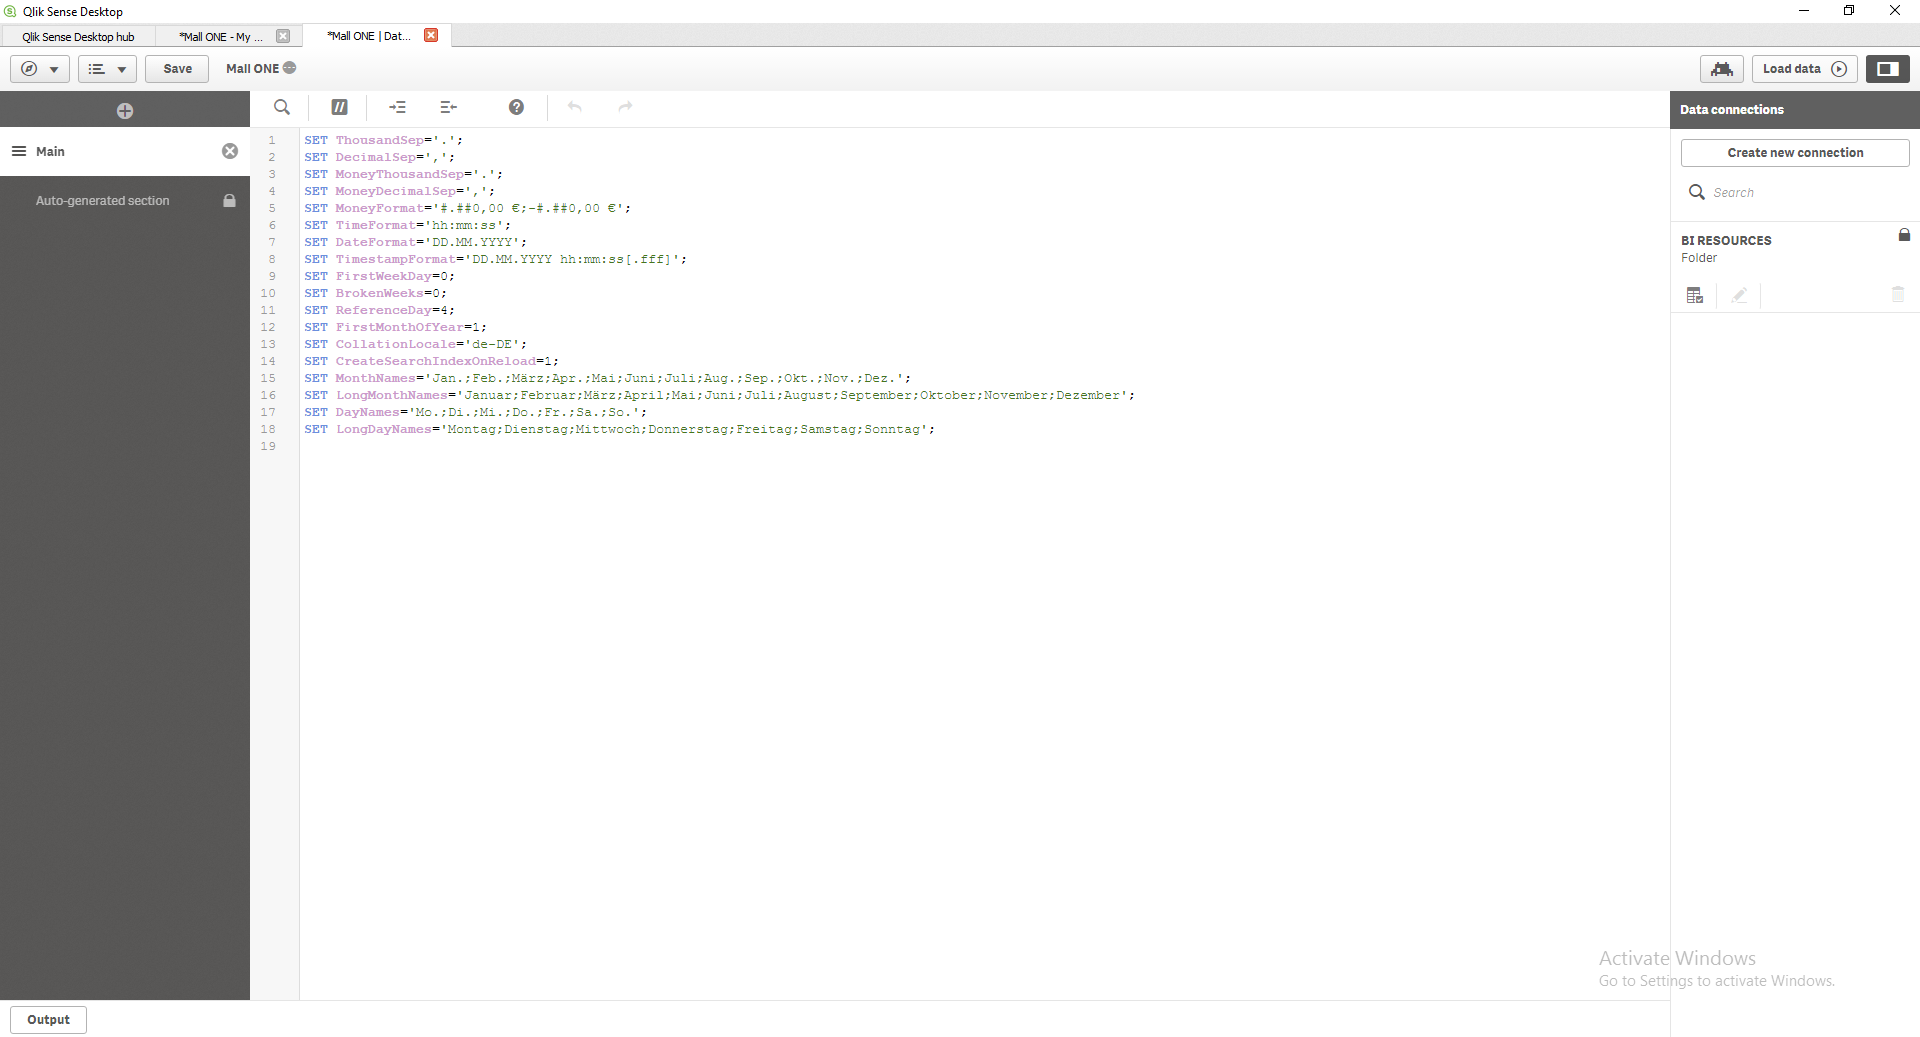
I have done the following. I have gone to the "Data Load Editor" and modified the entire loading script so that the format of Dates is 100% compatible with my column Date. Before it was in standard Qlik Sense Desktop, and I have changed it to German format (DD.MM.YYYY), as it can be seen here:
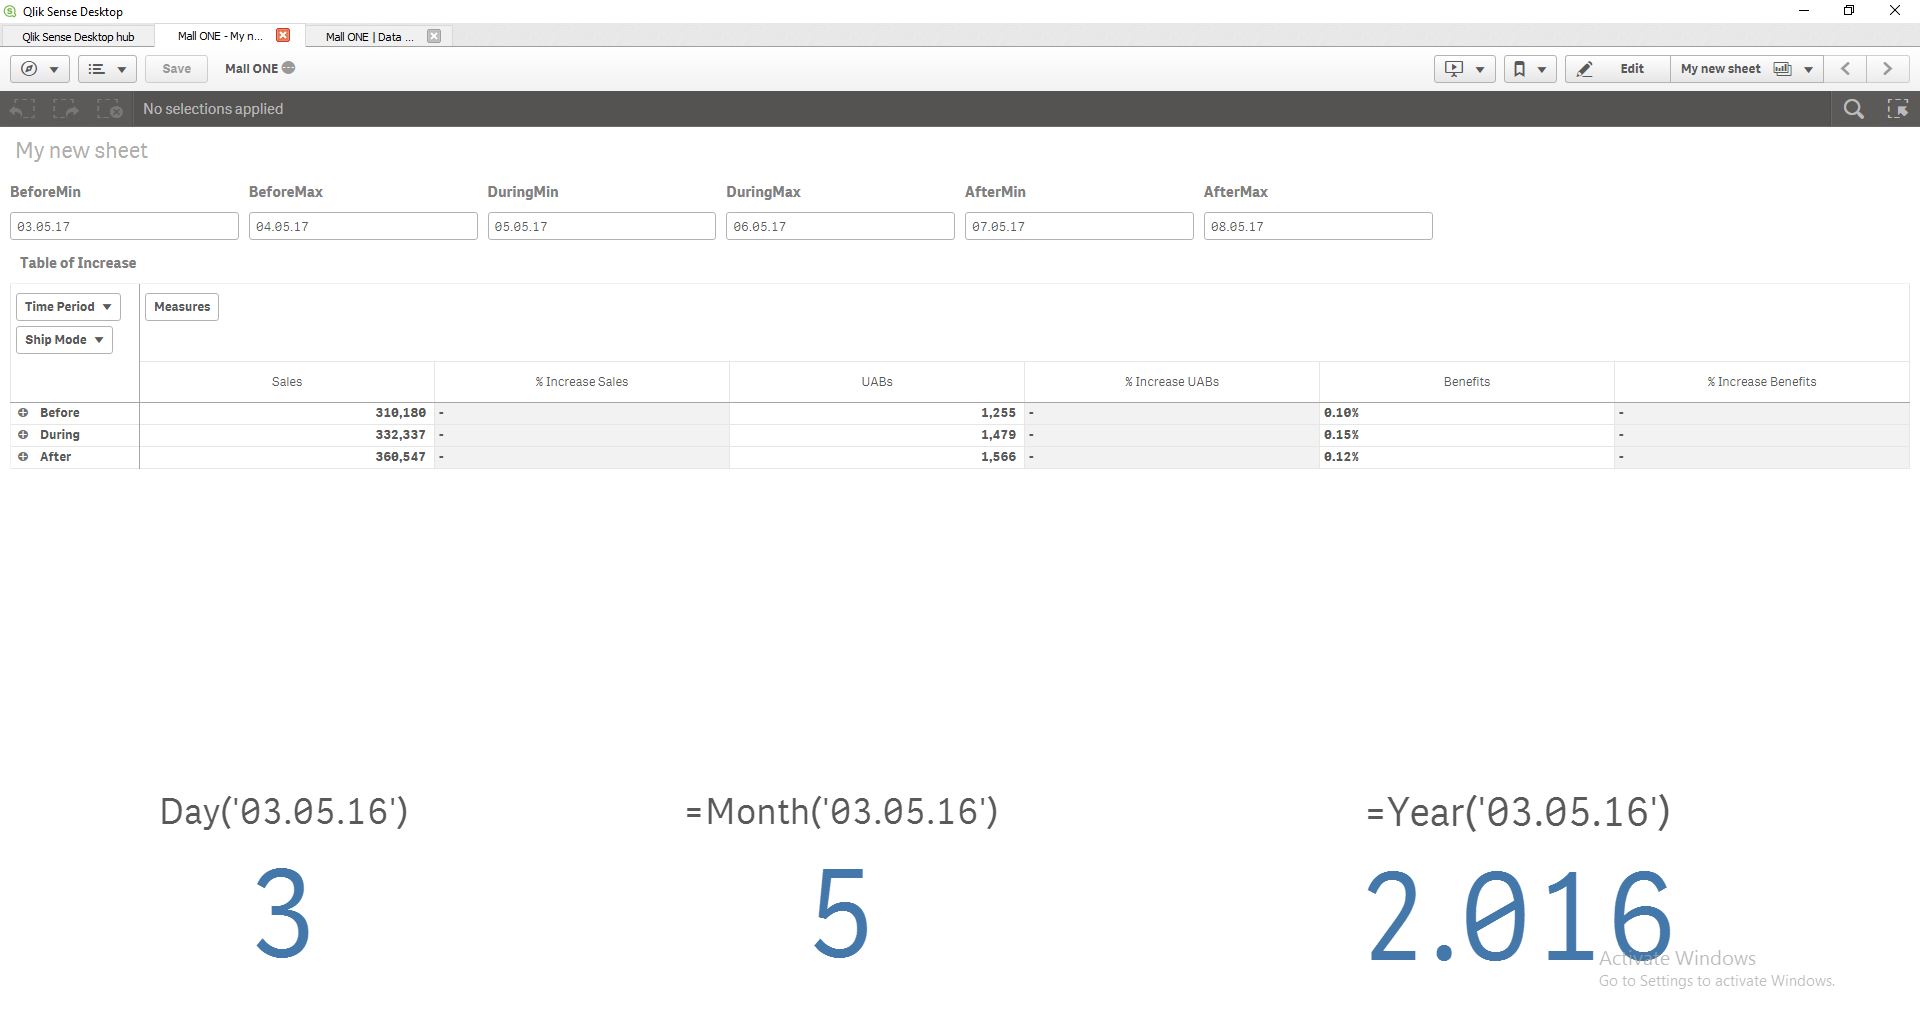
I have also updated my .qvf sample file. Now, my Date column I believe is in Date format as it can be seen through this functions (Day(), Year(), Month()):
Don´t know if this can be any helpful to make some progress/targets your suggestions? Thanks, Anibal