Unlock a world of possibilities! Login now and discover the exclusive benefits awaiting you.
- Qlik Community
- :
- Forums
- :
- Analytics
- :
- New to Qlik Analytics
- :
- Re: Pie chart : How to deal with Nulls
- Subscribe to RSS Feed
- Mark Topic as New
- Mark Topic as Read
- Float this Topic for Current User
- Bookmark
- Subscribe
- Mute
- Printer Friendly Page
- Mark as New
- Bookmark
- Subscribe
- Mute
- Subscribe to RSS Feed
- Permalink
- Report Inappropriate Content
Pie chart : How to deal with Nulls
Hi,
I want to make a pie chart by
dimension as State and measure as exposure.
Also I want to show top 5 states on chart and remaining as others. I did this by

My Graph shows
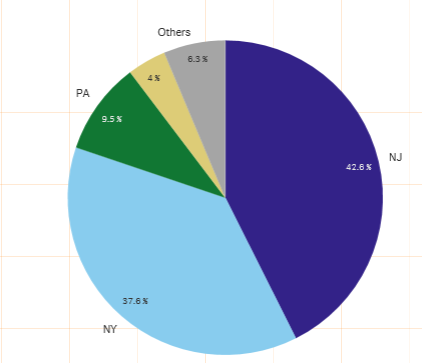
Problem: Here yellow portion which shows 4% are having State value as 'Null'. I want to show these Nulls to include into the 'Others' and want only 5 states with valid value to be displayed. How to do this?
Thanks,
Shweta
- « Previous Replies
-
- 1
- 2
- Next Replies »
- Mark as New
- Bookmark
- Subscribe
- Mute
- Subscribe to RSS Feed
- Permalink
- Report Inappropriate Content
Replace nulls as N/A in the script.
- Mark as New
- Bookmark
- Subscribe
- Mute
- Subscribe to RSS Feed
- Permalink
- Report Inappropriate Content
Sorry.. I didn't get this. Can you please explain little in detail. I don't want to exclude those values in pie chart.
- Mark as New
- Bookmark
- Subscribe
- Mute
- Subscribe to RSS Feed
- Permalink
- Report Inappropriate Content
In ur script do the following
if(isnull(field),'N/A',field) as Field
By doing this ur nulls become N/A and this will club into the others.
To show values instead of share then the change the option share to value in Presentation-ValueLabels
- Mark as New
- Bookmark
- Subscribe
- Mute
- Subscribe to RSS Feed
- Permalink
- Report Inappropriate Content
hello
on the pie chart dimension put on your expression the following :
if(len(State)=0,'N/A',State)
- Mark as New
- Bookmark
- Subscribe
- Mute
- Subscribe to RSS Feed
- Permalink
- Report Inappropriate Content
Thanks you Uday and Fathi,
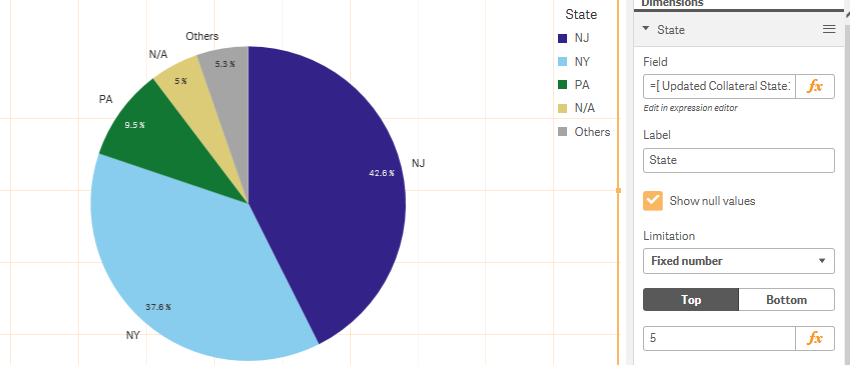
I tried both options which gives me graph as

This is not counting 'N/A/ as Others.
Is this to deal with Qlik version? I am using Qlik Sense 3.1
Thanks,
Shweta
- Mark as New
- Bookmark
- Subscribe
- Mute
- Subscribe to RSS Feed
- Permalink
- Report Inappropriate Content
Thanks you Uday and Fathi,
I tried both options which gives me graph as
This is not counting 'N/A/ as Others.
Is this to deal with Qlik version? I am using Qlik Sense 3.1
Thanks,
Shweta
- Mark as New
- Bookmark
- Subscribe
- Mute
- Subscribe to RSS Feed
- Permalink
- Report Inappropriate Content
do you want to hide the null values ? or you want to display them with a name as we show you ?
- Mark as New
- Bookmark
- Subscribe
- Mute
- Subscribe to RSS Feed
- Permalink
- Report Inappropriate Content
if you want to hide the null values
logically the others contain a lot of different values of state and all have less than the top 5 in your example and the null values is considerated as one state this is why it's counted with the top 5
- Mark as New
- Bookmark
- Subscribe
- Mute
- Subscribe to RSS Feed
- Permalink
- Report Inappropriate Content
Thanks,
I don't want to hide those Null Values. I just want to show them as a part of OTHERS. I want
top Four states and one Other to display in Pie Chart.
Other should have remaining states and Nulls irrespective of its share value.
- « Previous Replies
-
- 1
- 2
- Next Replies »