Unlock a world of possibilities! Login now and discover the exclusive benefits awaiting you.
- Qlik Community
- :
- Forums
- :
- Analytics
- :
- New to Qlik Analytics
- :
- Re: Pie chart
- Subscribe to RSS Feed
- Mark Topic as New
- Mark Topic as Read
- Float this Topic for Current User
- Bookmark
- Subscribe
- Mute
- Printer Friendly Page
- Mark as New
- Bookmark
- Subscribe
- Mute
- Subscribe to RSS Feed
- Permalink
- Report Inappropriate Content
Pie chart
Hi ,
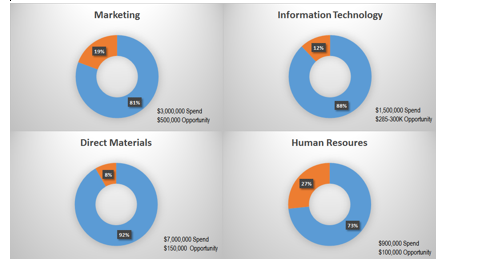
please tell me how can i acheive this in qlik sense, i want to show category wise spend vs total spend..pls suggest ...
- Mark as New
- Bookmark
- Subscribe
- Mute
- Subscribe to RSS Feed
- Permalink
- Report Inappropriate Content
Hi,
May be you can search for extensions in QlikBranch hope you ill get lot of Extensions to achieve like above.
- Mark as New
- Bookmark
- Subscribe
- Mute
- Subscribe to RSS Feed
- Permalink
- Report Inappropriate Content
Well you could create 4 separate pie/doughnut charts and use set analysis and calculated dimensions to achieve this quite quickly.
A more dynamic solution you would look to trellis your chart on category but I've only seen this extension on branch for bar chart.
- Mark as New
- Bookmark
- Subscribe
- Mute
- Subscribe to RSS Feed
- Permalink
- Report Inappropriate Content
Hello Praveen,
You can create four different dimensions for each chart (Donut Chart):
If([Customer Segment] = 'Marketing', 'Marketing', 'Others')
If([Customer Segment] = 'Information Technology', 'Information Technology', 'Others')
If([Customer Segment] = 'Direct Materials', 'Direct Materials', 'Others')
If([Customer Segment] = 'Human Resources', 'Human Resources', 'Others')
Hope this will help.
Regards!
Rahul
- Mark as New
- Bookmark
- Subscribe
- Mute
- Subscribe to RSS Feed
- Permalink
- Report Inappropriate Content
Try this extension Qlik Branch