Unlock a world of possibilities! Login now and discover the exclusive benefits awaiting you.
- Qlik Community
- :
- Forums
- :
- Analytics
- :
- New to Qlik Analytics
- :
- Pivot Table in QlikSense
- Subscribe to RSS Feed
- Mark Topic as New
- Mark Topic as Read
- Float this Topic for Current User
- Bookmark
- Subscribe
- Mute
- Printer Friendly Page
- Mark as New
- Bookmark
- Subscribe
- Mute
- Subscribe to RSS Feed
- Permalink
- Report Inappropriate Content
Pivot Table in QlikSense
Dear All,
I have data sample as give below (full sample file attached)
Sample Data
| 1monthStatus | 3monthStatus | 6monthStatus | 12monthStatus |
| NoChange | |||
| NoChange | NoChange | ||
| NoChange | |||
| NoChange | NoChange | ||
| NoChange | Quit | Quit | |
| NoChange | NoChange | Reduced |
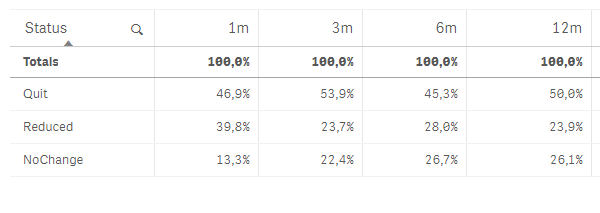
can anybody help in producing pivot table in Qlik Sense like give below. ( I want to use only chart function no any other reformatting of data table in load script since it will change data model. Thanks
Desired Table in QlikSense

.
- Mark as New
- Bookmark
- Subscribe
- Mute
- Subscribe to RSS Feed
- Permalink
- Report Inappropriate Content
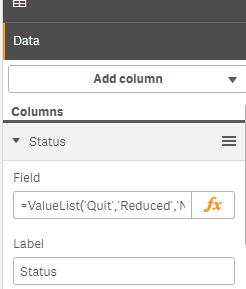
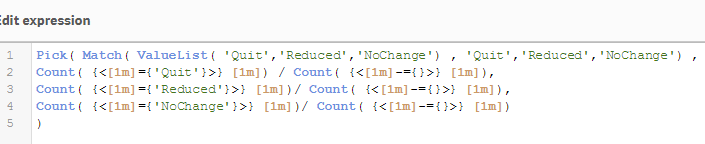
I have a solution for you built on a straight table by only employing chart functions. Since you don't have a dimension field in the data model when importing the raw data unmodified into Qlik Sense I used the ValueList(...) function to create a synthetic dimension. Then I will have to refer to the exactly the same ValueList in the expressions for the various measures for each time category. Have a look at the attached app.
- Mark as New
- Bookmark
- Subscribe
- Mute
- Subscribe to RSS Feed
- Permalink
- Report Inappropriate Content
Hi Petter,
Thanks for the solution. Can I have QVF attached. I have synthetic dimension and used the expression for measure. But I couldn't get it how did you procued 1m/3/m/12/ etc in columns. Thanks