Unlock a world of possibilities! Login now and discover the exclusive benefits awaiting you.
- Qlik Community
- :
- Forums
- :
- Analytics
- :
- New to Qlik Analytics
- :
- Re: Possible to add a trend line to a scatter plot...
- Subscribe to RSS Feed
- Mark Topic as New
- Mark Topic as Read
- Float this Topic for Current User
- Bookmark
- Subscribe
- Mute
- Printer Friendly Page
- Mark as New
- Bookmark
- Subscribe
- Mute
- Subscribe to RSS Feed
- Permalink
- Report Inappropriate Content
Possible to add a trend line to a scatter plot in QlikSense?
Hi folks, just wondering if anybody knows how to add a trend-line to an existing scatter plot in Qliksense or if it's even possible? I've looked at different options available under the scatter plot options and am not seeing any. Thanks!!
- « Previous Replies
- Next Replies »
- Mark as New
- Bookmark
- Subscribe
- Mute
- Subscribe to RSS Feed
- Permalink
- Report Inappropriate Content
I'm just wondering what the data do you have at your scatter plot chart to add trend line?
You have at least two measures? How can you imagine a trend line there?
Or you mean reference line?
Sergey
- Mark as New
- Bookmark
- Subscribe
- Mute
- Subscribe to RSS Feed
- Permalink
- Report Inappropriate Content
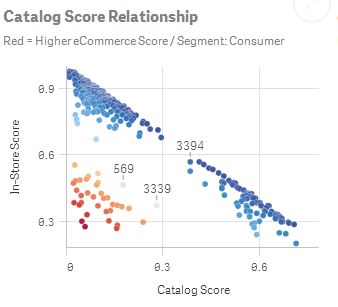
Hi Sergey, I do have 2 measures and have set up a scatter plot in sense per screenshot below-

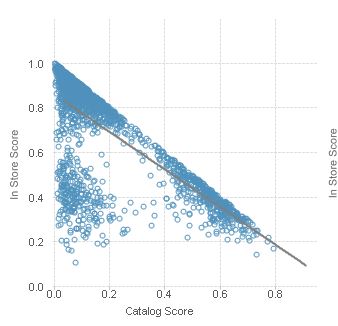
And I was hoping to add the trend line in QlikSense similar to the screenshot below, which is from Qlikview. I imagine it'd be a simple regression formula with y = mx+b. I've tried the reference line option in Sense but it seems to only allow a numerical value, not a function.

- Mark as New
- Bookmark
- Subscribe
- Mute
- Subscribe to RSS Feed
- Permalink
- Report Inappropriate Content
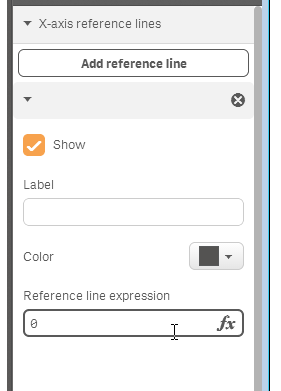
Hi Jin - do you see the fx symbol in the Add-ons section for the Reference line input?-Here you should be able to enter in an expression for the reference line.

Let me know how you do.
Please mark the appropriate replies as helpful / correct so our team and other members know that your question(s) has been answered to your satisfaction.
Mike
Mike Tarallo
Qlik
- Mark as New
- Bookmark
- Subscribe
- Mute
- Subscribe to RSS Feed
- Permalink
- Report Inappropriate Content
Also - see this existing discussion which has a sample solution, this may help you: Re: How to add lineal trend in Qlik sense
Mike
Mike Tarallo
Qlik
- Mark as New
- Bookmark
- Subscribe
- Mute
- Subscribe to RSS Feed
- Permalink
- Report Inappropriate Content
Hello Jin,
Do you still require assistance, did you try out the solution I provided via that link in this discussion.
Please let us know.
Please mark the appropriate replies as helpful / correct so our team and other members know that your question(s) has been answered to your satisfaction.
Mike
Mike Tarallo
Qlik
- Mark as New
- Bookmark
- Subscribe
- Mute
- Subscribe to RSS Feed
- Permalink
- Report Inappropriate Content
Hi Jin
In the current version of Qlik Sense you can't select trendlines (Average, Linear, etc.) like in QlikView (Chart Properties ->Expressions tab) just by mark it.
Like Michael already explained you have the possibility to create your reference lines by a formula and add to your chart. It's a little bit more work than just mark a checkbox but also give you more flexibility to define your trendlines.
Regards
Ronny
- Mark as New
- Bookmark
- Subscribe
- Mute
- Subscribe to RSS Feed
- Permalink
- Report Inappropriate Content
Just wondering if you found a solution for this in Sense?
- Mark as New
- Bookmark
- Subscribe
- Mute
- Subscribe to RSS Feed
- Permalink
- Report Inappropriate Content
Hello Matt - I have verified that a lineal trend line is not available in a scatter plot as select-able option, but is on the road-map. Also I verified that the work-around described in this thread that I provided only works with a combo and other charts that can accept multiple measures, but not a scatter plot.
HTH
Regards,
Michael Tarallo (@mtarallo) | Twitter
Qlik
Mike Tarallo
Qlik
- Mark as New
- Bookmark
- Subscribe
- Mute
- Subscribe to RSS Feed
- Permalink
- Report Inappropriate Content
Thank you for the reply Michael. I will seek out an alternative, probably with a d3 plugin..
- « Previous Replies
- Next Replies »