Unlock a world of possibilities! Login now and discover the exclusive benefits awaiting you.
- Qlik Community
- :
- Forums
- :
- Analytics
- :
- New to Qlik Analytics
- :
- Re: Price variation - Count function
- Subscribe to RSS Feed
- Mark Topic as New
- Mark Topic as Read
- Float this Topic for Current User
- Bookmark
- Subscribe
- Mute
- Printer Friendly Page
- Mark as New
- Bookmark
- Subscribe
- Mute
- Subscribe to RSS Feed
- Permalink
- Report Inappropriate Content
Price variation - Count function
Hi everyone,
I do use a Count funciton in a KPI object to calculate the number of prices which went up over the laster year but I cannot make it with my current formula!
Count(Avg([Year]={2016})Price >Avg([Year]={2017})Price)
Do you have any tips or advices?
Thanks a lot
Florian
- « Previous Replies
-
- 1
- 2
- Next Replies »
Accepted Solutions
- Mark as New
- Bookmark
- Subscribe
- Mute
- Subscribe to RSS Feed
- Permalink
- Report Inappropriate Content
What is the expression you are using? May be you need to use Rounding here? Round to 2 digits for matching?
- Mark as New
- Bookmark
- Subscribe
- Mute
- Subscribe to RSS Feed
- Permalink
- Report Inappropriate Content
May be this
Sum(Aggr(If(Avg({<[Year]={2016}>}Price) > Avg({<[Year]={2017}>}Price), 1, 0), ProductID))
Assuming we are talking about the prices for a product. Change this to a field for which you are doing the price comparison
- Mark as New
- Bookmark
- Subscribe
- Mute
- Subscribe to RSS Feed
- Permalink
- Report Inappropriate Content
For prices that went up... you might need this
Sum(Aggr(If(Avg({<[Year]={2016}>}Price) < Avg({<[Year]={2017}>}Price), 1, 0), ProductID))
- Mark as New
- Bookmark
- Subscribe
- Mute
- Subscribe to RSS Feed
- Permalink
- Report Inappropriate Content
Hi Sunny,
Thank you for your answer and your reactivity 
I do get a figure in my KPI but which does not work exactly. I do have a lot of mising data for 2017 and my KPI takes some of them into account. Shall I include an IF within my current function to sort this out?
Thank you again
Cheers
Florian
- Mark as New
- Bookmark
- Subscribe
- Mute
- Subscribe to RSS Feed
- Permalink
- Report Inappropriate Content
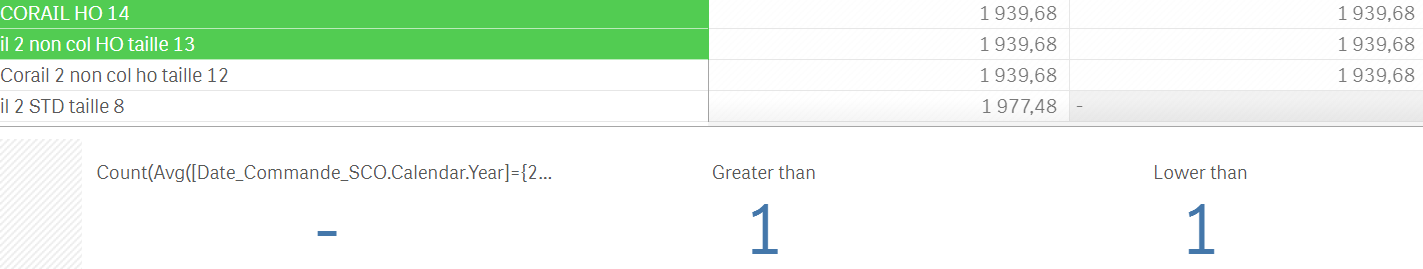
Look at the two selected fields, one of them gives me the result "greater than" and the second "lower than" and I need them to be ricorded as equal.
It might be an very small difference or simply the function which doesn't work as hoped
Best,
Florian
- Mark as New
- Bookmark
- Subscribe
- Mute
- Subscribe to RSS Feed
- Permalink
- Report Inappropriate Content
I am not completely sure I understand what you are trying to convey here. Can you elaborate?
- Mark as New
- Bookmark
- Subscribe
- Mute
- Subscribe to RSS Feed
- Permalink
- Report Inappropriate Content
Hi Sunny,
So you might be confused with the names "Greater than" & "Lower than". My PivotTable aims to reflect the number of prices which are going up (greater than) and down (lower than) between 2016 (1st column) and 2017 (2nd column).
I am trying to find the correct formula to display this result within my two KPI boxes.
Do you have an idea how I could edit my formula to get the correct answer?
Thanks,
Florian
- Mark as New
- Bookmark
- Subscribe
- Mute
- Subscribe to RSS Feed
- Permalink
- Report Inappropriate Content
What is the expression you are using? May be you need to use Rounding here? Round to 2 digits for matching?
- Mark as New
- Bookmark
- Subscribe
- Mute
- Subscribe to RSS Feed
- Permalink
- Report Inappropriate Content
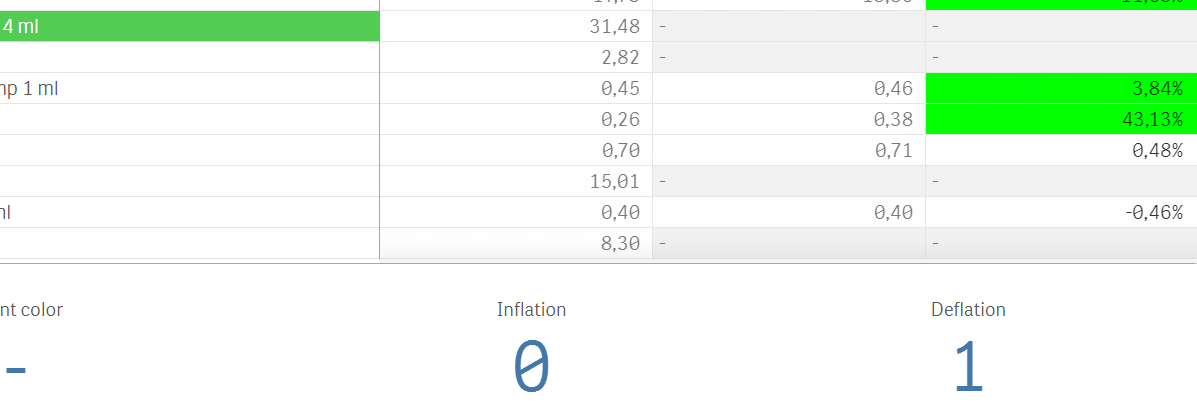
Yeah thank you, it seems to work for these references but my formulation takes sometime the null value into account(as zero value I guess).
If you have a look at the following table you will see one single selected field which should not increase my Delflation KPI. Do you have an idea how to solve this? Using a null() function might be appropriate in this case, right?
My KPI formula:
Sum(Aggr(If(round(Avg({<[Year]={2016}>}Price),0.01) > round(Avg
({<[Year]={2017}>}Price),0.01), 1, 0),Supplier))
I tried to insert a null() function but it doesn't really work:
Sum(Aggr(If(if(null(Avg({<[Year]={2016}>}Price)),0, round
(Avg({<[Year]={2016}>}Price),0.01)) < if(null
(Avg({<[Year]={2017}>}Price)),0, round(Avg
({<[Year]={2017}>}Price),0.01)), 1, 0),Supplier))
Moreover, I am using this expression for the color format. If you look at my table the Delta (-0.46%) is not displayed in red as I wish, is the round() function not used correctly?
if((Avg({1<[Year]={2017} >}Price)-Avg({1<[Year]
={2016} >}Price))/Avg({1<[Year]={2016} >}Price)>0,black(),if((Avg({1<[Year]={2017} >}Price)-Avg({1<[Year]
={2016} >}Price))/Avg({1<[Year]={2016} >}Price)<0,black(),))
It would be wonderful if you had an idea how I could get out this mess 
Thanks a lot
Florian
- Mark as New
- Bookmark
- Subscribe
- Mute
- Subscribe to RSS Feed
- Permalink
- Report Inappropriate Content
May be try this
Sum(Aggr(If(Round(Avg({<[Year] = {2016}>} Price), 0.01) > Round(Avg({<[Year] = {2017}>} Price), 0.01) and Len(Trim(Avg({<[Year]={2016}>}Price))) > 0 and Len(Trim(Avg({<[Year]={2016}>}Price))) > 0, 1, 0), Supplier))
Where are you specifying the red color in this expression? All I see is black()?
if((Avg({1<[Year]={2017} >}Price)-Avg({1<[Year]
={2016} >}Price))/Avg({1<[Year]={2016} >}Price)>0,black(),if((Avg({1<[Year]={2017} >}Price)-Avg({1<[Year]
={2016} >}Price))/Avg({1<[Year]={2016} >}Price)<0,black(),))
- « Previous Replies
-
- 1
- 2
- Next Replies »