Unlock a world of possibilities! Login now and discover the exclusive benefits awaiting you.
- Qlik Community
- :
- Forums
- :
- Analytics
- :
- New to Qlik Analytics
- :
- Re: Prob regarding visualisation in QLikSense
- Subscribe to RSS Feed
- Mark Topic as New
- Mark Topic as Read
- Float this Topic for Current User
- Bookmark
- Subscribe
- Mute
- Printer Friendly Page
- Mark as New
- Bookmark
- Subscribe
- Mute
- Subscribe to RSS Feed
- Permalink
- Report Inappropriate Content
Prob regarding visualisation in QLikSense
Hello,
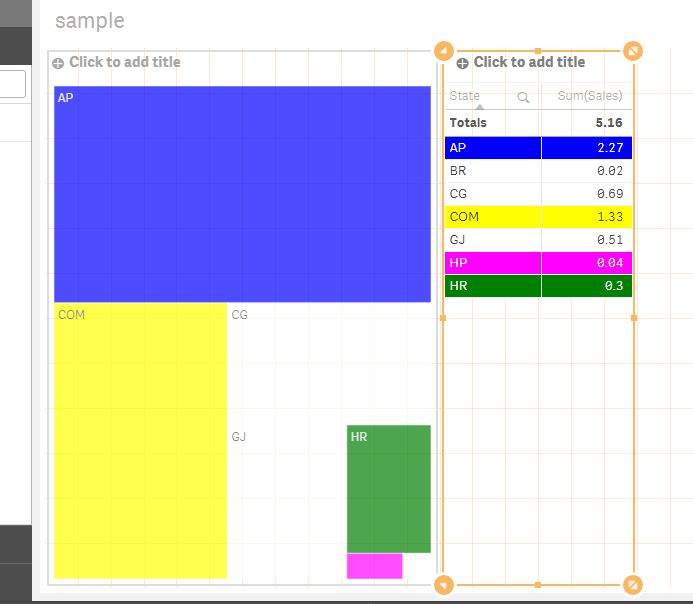
I have a situation where i need to color the rows of table as per the color in other chart. Pls. find my attached snapshot for more understanding.
In Mekko chart, as you can see states has a particular color. In the table next to it, i want the rows to be colored with same color as in Mekko chart. I cannt find a way to achieve this. Can anyone help me in this?
Thanks,
Nikhil garg
- Mark as New
- Bookmark
- Subscribe
- Mute
- Subscribe to RSS Feed
- Permalink
- Report Inappropriate Content
Hi,
what is the issue here? u can simple write color conditional statement like below
simply write this expression in both your chart --> back ground color expression
if(State='AP' ,LightBlue(), if(State='COM',Yellow(),if(State='HR',Green(),if(State='HP',LightMagenta(), White()))))
// here u can add u r own custom color
- Mark as New
- Bookmark
- Subscribe
- Mute
- Subscribe to RSS Feed
- Permalink
- Report Inappropriate Content
HEy,
Problem is i am using Pivot table. ANd in pivot table, we dont have background color option in dimension
I cann't use straight table because, i ahve to dynamically name my measures as:
1: Sales' $(=Only(Year)-1) and this function will only evaluate in Pivot Table.
ANy other option?
- Mark as New
- Bookmark
- Subscribe
- Mute
- Subscribe to RSS Feed
- Permalink
- Report Inappropriate Content
Try to follow the online help - starting from here - since it is possible Pivot table properties ‒ Qlik Sense
FM
(please tell us what solution you find)
- Mark as New
- Bookmark
- Subscribe
- Mute
- Subscribe to RSS Feed
- Permalink
- Report Inappropriate Content
In pivot table, i have looked the possibilites but not feasible. Can you let me know if in straight table we can make dynamic labels for measure?
- Mark as New
- Bookmark
- Subscribe
- Mute
- Subscribe to RSS Feed
- Permalink
- Report Inappropriate Content
I think no since cells are not labels.