- Mark as New
- Bookmark
- Subscribe
- Mute
- Subscribe to RSS Feed
- Permalink
- Report Inappropriate Content
QS pivot table : How to get totals at the bottom?
Hi,
I'm working with Pivot table in a financial dashboard and I wanna to get a total row at the bottom.
Please I need your help?
Thanks in advance
- Tags:
- pivot table totals
Accepted Solutions
- Mark as New
- Bookmark
- Subscribe
- Mute
- Subscribe to RSS Feed
- Permalink
- Report Inappropriate Content
Hi Hanan,
The "position" property as you have mentioned is not available in the pivot table. If its a mandatory requirement , I would suggest you to add an extra dimension value as total and display in the bottom by sorting it. You can even build an extension to achieve the same.
Thanks and Regards,
Sangram Reddy.
- Mark as New
- Bookmark
- Subscribe
- Mute
- Subscribe to RSS Feed
- Permalink
- Report Inappropriate Content
- Mark as New
- Bookmark
- Subscribe
- Mute
- Subscribe to RSS Feed
- Permalink
- Report Inappropriate Content
Hi Hanan,
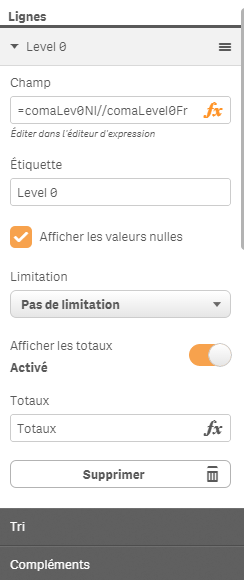
You have a property in the properties panel. By using that toggle button you can display totalls.
Thanks and Regards,
Sangram Reddy.
- Mark as New
- Bookmark
- Subscribe
- Mute
- Subscribe to RSS Feed
- Permalink
- Report Inappropriate Content
Thanks for your answer. But it seems I have to touch my data model something that is not obvious to my case ![]()
For more information about what I need, here you are a print screen for my pivot table:

I wanna a Total not at the top but at the bottom of my pivot table.
Regards,
Hanan
- Mark as New
- Bookmark
- Subscribe
- Mute
- Subscribe to RSS Feed
- Permalink
- Report Inappropriate Content
Hi Sangram,
Thanks for your answer,
That's true for Table object, but for pivot table this option "Position" doen't exists!

Regards,
Hanan Echchatt
- Mark as New
- Bookmark
- Subscribe
- Mute
- Subscribe to RSS Feed
- Permalink
- Report Inappropriate Content
Hi Hanan,
The "position" property as you have mentioned is not available in the pivot table. If its a mandatory requirement , I would suggest you to add an extra dimension value as total and display in the bottom by sorting it. You can even build an extension to achieve the same.
Thanks and Regards,
Sangram Reddy.
- Mark as New
- Bookmark
- Subscribe
- Mute
- Subscribe to RSS Feed
- Permalink
- Report Inappropriate Content
How do you add an extra dimension? Also what is an extension?
- Mark as New
- Bookmark
- Subscribe
- Mute
- Subscribe to RSS Feed
- Permalink
- Report Inappropriate Content
an extension is side apps that you can add to qliksense that can be used. Visit vizlib.com and you could see the different custom objects you could have such as sparklines and a different pivot table.