Unlock a world of possibilities! Login now and discover the exclusive benefits awaiting you.
- Qlik Community
- :
- Forums
- :
- Analytics
- :
- New to Qlik Analytics
- :
- Qlik Sense Line Chart weird behavior
- Subscribe to RSS Feed
- Mark Topic as New
- Mark Topic as Read
- Float this Topic for Current User
- Bookmark
- Subscribe
- Mute
- Printer Friendly Page
- Mark as New
- Bookmark
- Subscribe
- Mute
- Subscribe to RSS Feed
- Permalink
- Report Inappropriate Content
Qlik Sense Line Chart weird behavior
Hi Qlik Experts,
I'm experiencing weird behavior in Qlik Sense SaaS
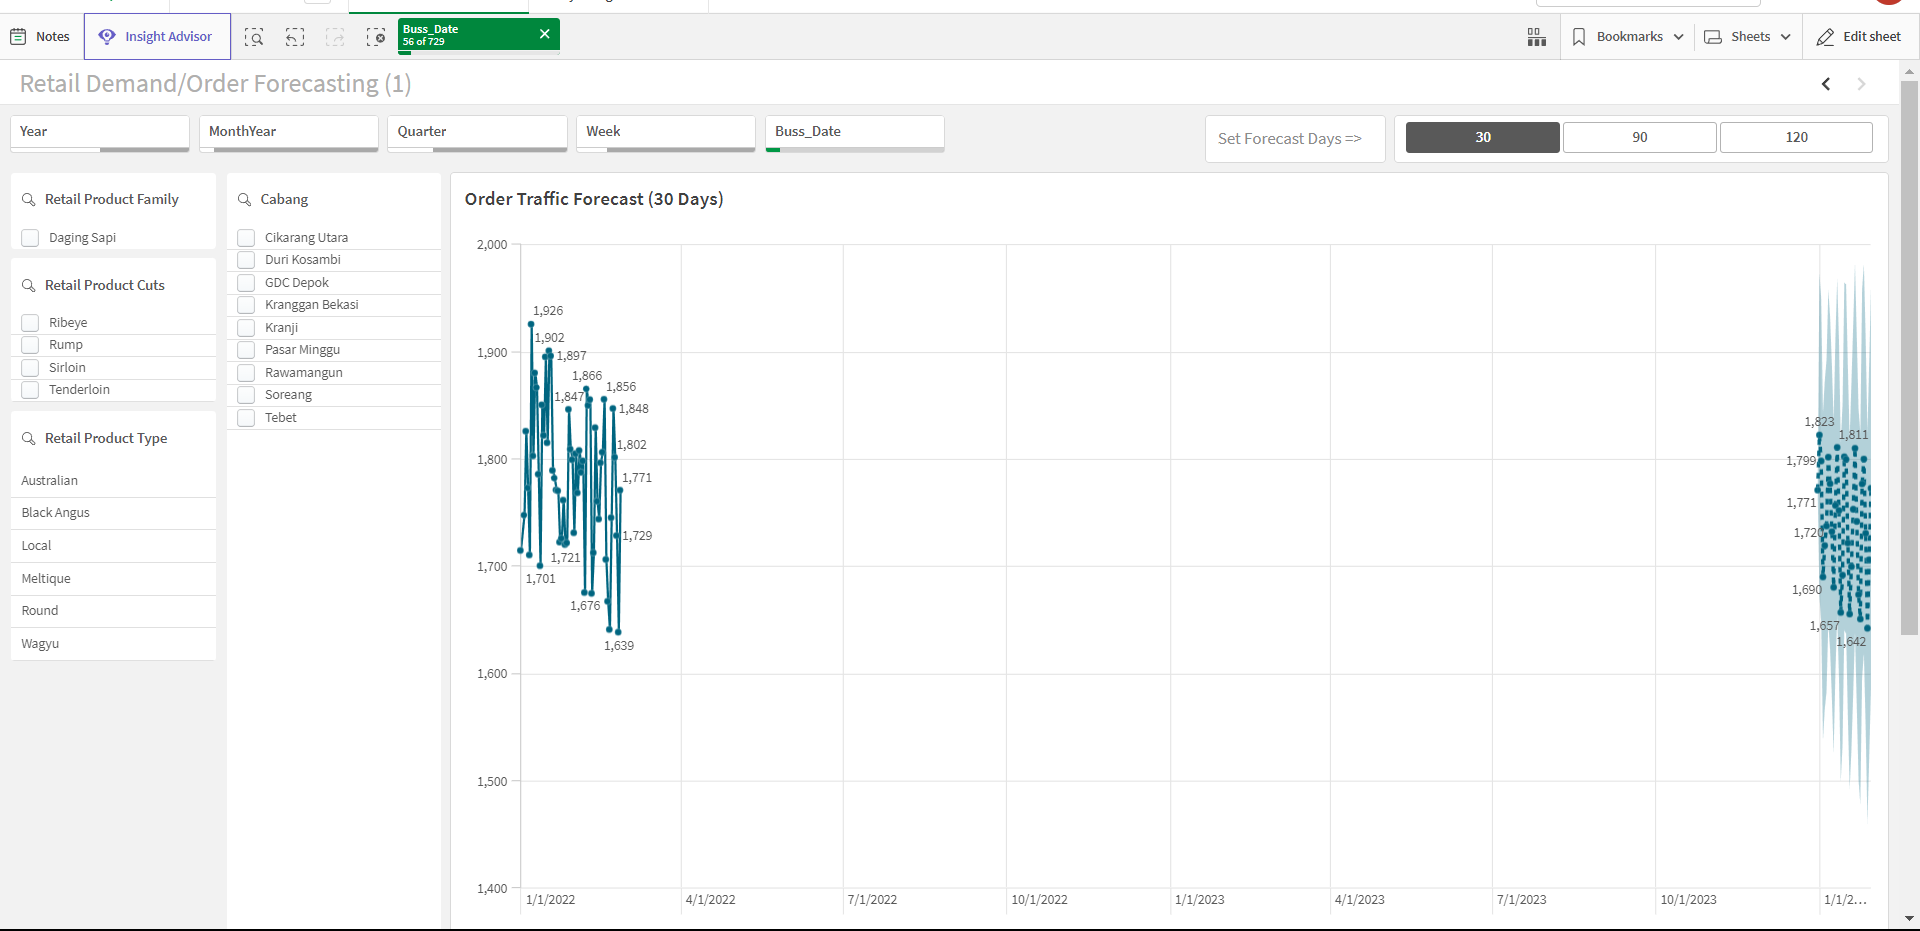
I was trying out the forecast capability in line chart,and when I applied Section Access into the app, the line chart shows
lines which I'm not filtering at, and on shows the wrong date
the chart, shows correctly, if I don't load the Section Access though.
does anyone experience the same thing?
scripts, & images attached
- Tags:
- forecast
- line chart
- Subscribe by Topic:
-
Chart
-
Data Load Editor
-
SaaS
-
Script
-
Section Access
-
Visualization
- Mark as New
- Bookmark
- Subscribe
- Mute
- Subscribe to RSS Feed
- Permalink
- Report Inappropriate Content
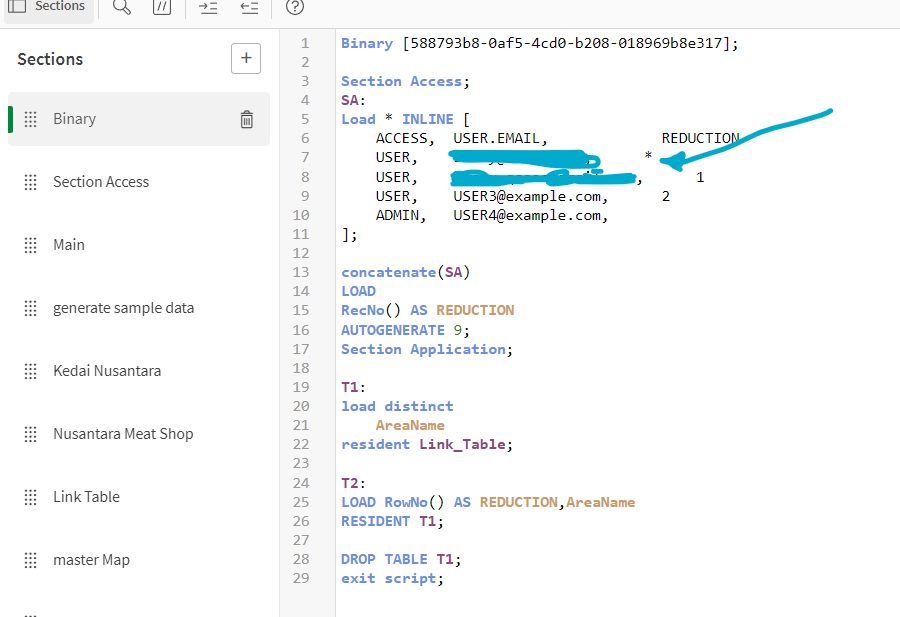
The * wildcard within the section access considers only data within this load - all not explicitly listed values are excluded.
- Mark as New
- Bookmark
- Subscribe
- Mute
- Subscribe to RSS Feed
- Permalink
- Report Inappropriate Content
thanks for the response, but I think that's not the case,
I made sure to concatenate all the REDUCTION value (1 until 9) into the section access table before stating the section application;
and the REDUCTION correlates with the "cabang" field on the filter pane
you can compare the line chart images with/without SA
all the value on "cabang" field are the same because it is showing all the reduction value
I also tried to map the user with reduction 1 - 9 (9 rows of inline data), but it the line chart forecast also behaves weirdly (the selection should reflect date from Nov to Dec, but the line chart shows from Jan-Feb Instead)
I only used "sum(amt)" for the measure expression used

- Mark as New
- Bookmark
- Subscribe
- Mute
- Subscribe to RSS Feed
- Permalink
- Report Inappropriate Content
A chart is seldom useful to detect the causes to any unexpected results. Therefore I suggest you use a table-box and pulls there all relevant fields. Further helpful is often to place there any unique id and if none exists to create some with recno() and rowno() in the script.
- Mark as New
- Bookmark
- Subscribe
- Mute
- Subscribe to RSS Feed
- Permalink
- Report Inappropriate Content
for the data,
I can confirm that the Section access works fine

I am just asking why the line chart behave weirdly like this, if I enabled the forecast feature while having section access
if I disabled the forecast feature / disabled continuous scale it behaves as it should

- Mark as New
- Bookmark
- Subscribe
- Mute
- Subscribe to RSS Feed
- Permalink
- Report Inappropriate Content
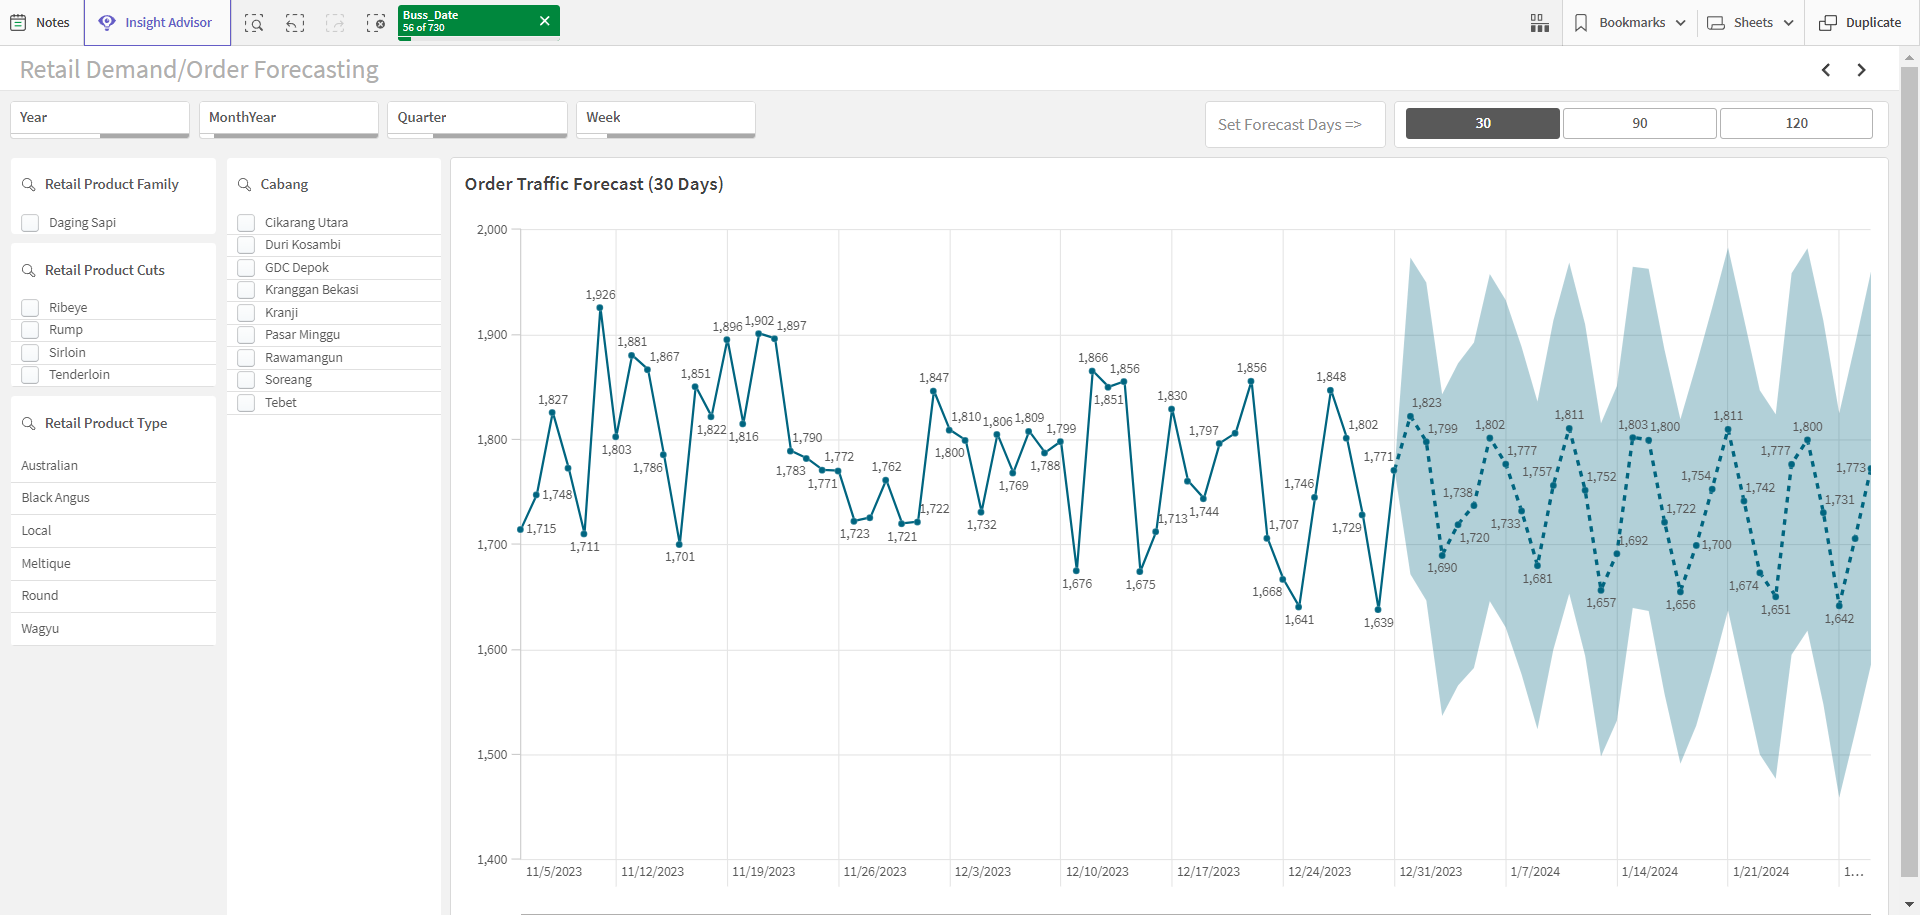
this has nothing to do with section access, and it is behaving as expected
Im assuming you are trying to OVERLAY Previous Year line and Current Year line with the Forecast enabled
I can see 2022 dates and 2023 dates been selected as well, since forecast needs a continuous axis you will we see the huge gap in the middle for the dates that have not been selected, with the forecast actually working for the 2023 data correctly
make sure the forecast steps parameters are set correctly and only choose recent date range
refer below
If a post helps to resolve your issue, please accept it as a Solution.
- Mark as New
- Bookmark
- Subscribe
- Mute
- Subscribe to RSS Feed
- Permalink
- Report Inappropriate Content
hi Vineeth,
thank you for your response, and sorry if the visual is a bit confusing.
I'm not trying to overlay previous year to current year
I've put a min max date KPI to let you see the min max date of the selections (I'm using Buss_date column name)
and also put a table with the monthYear of Buss_Date column to re-clarify,
why I'm saying the line chart is behaving weirdly
(I'm selecting Nov-Dec 2023 dates, but the line chart shows Jan-Feb instead)

here's the forecast step config
