Unlock a world of possibilities! Login now and discover the exclusive benefits awaiting you.
- Qlik Community
- :
- Forums
- :
- Analytics
- :
- New to Qlik Analytics
- :
- Qlik Sense Scatter Chart Dynamic Reference Line
- Subscribe to RSS Feed
- Mark Topic as New
- Mark Topic as Read
- Float this Topic for Current User
- Bookmark
- Subscribe
- Mute
- Printer Friendly Page
- Mark as New
- Bookmark
- Subscribe
- Mute
- Subscribe to RSS Feed
- Permalink
- Report Inappropriate Content
Qlik Sense Scatter Chart Dynamic Reference Line
Hello,
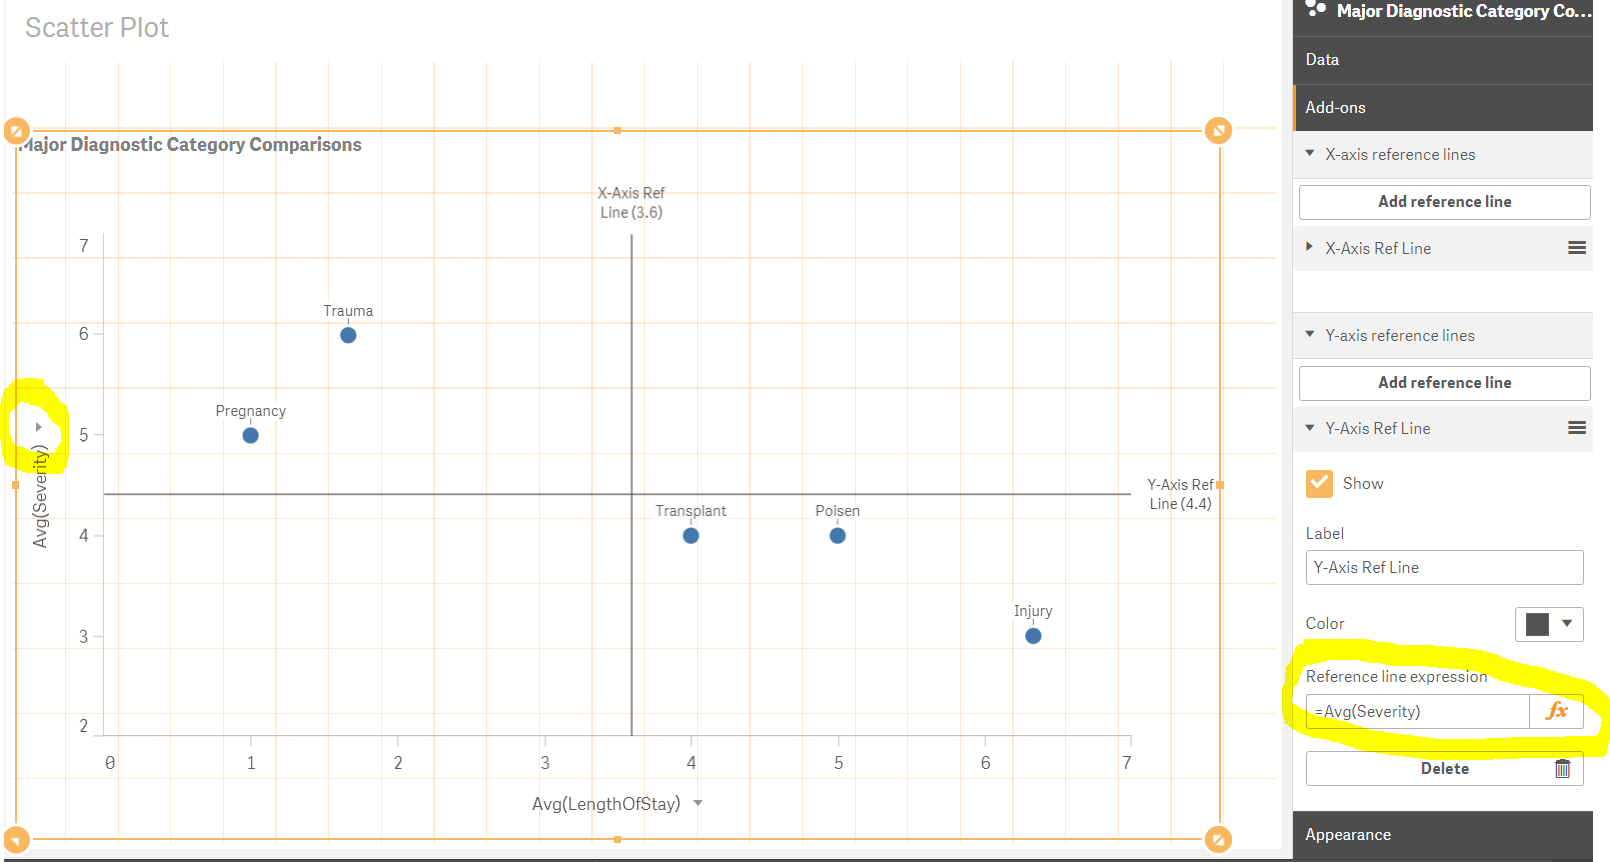
I am looking for a solution to make my reference lines within my scatter chart change dynamically based on the in chart measures chosen for the X and Y-Axis's.
I can set a static expression for the current Axis Measure Displayed, but when I select an Alternative Measure to display with the dropdown option, I would like the reference line to change dynamically to reflect the new dropdown selection measure.
- Mark as New
- Bookmark
- Subscribe
- Mute
- Subscribe to RSS Feed
- Permalink
- Report Inappropriate Content
Kevin,
Using this function (GetObjectMeasure(index)) you can get the first (index being 0) or second (index being 1) measure. It tells you the actual label string value. I then tried to get length since reference line requires a numeric value.
I renamed your first measure as ABCD and second as AB. I was hoping a simple IF condition can then be used to evaluate which one is selected.
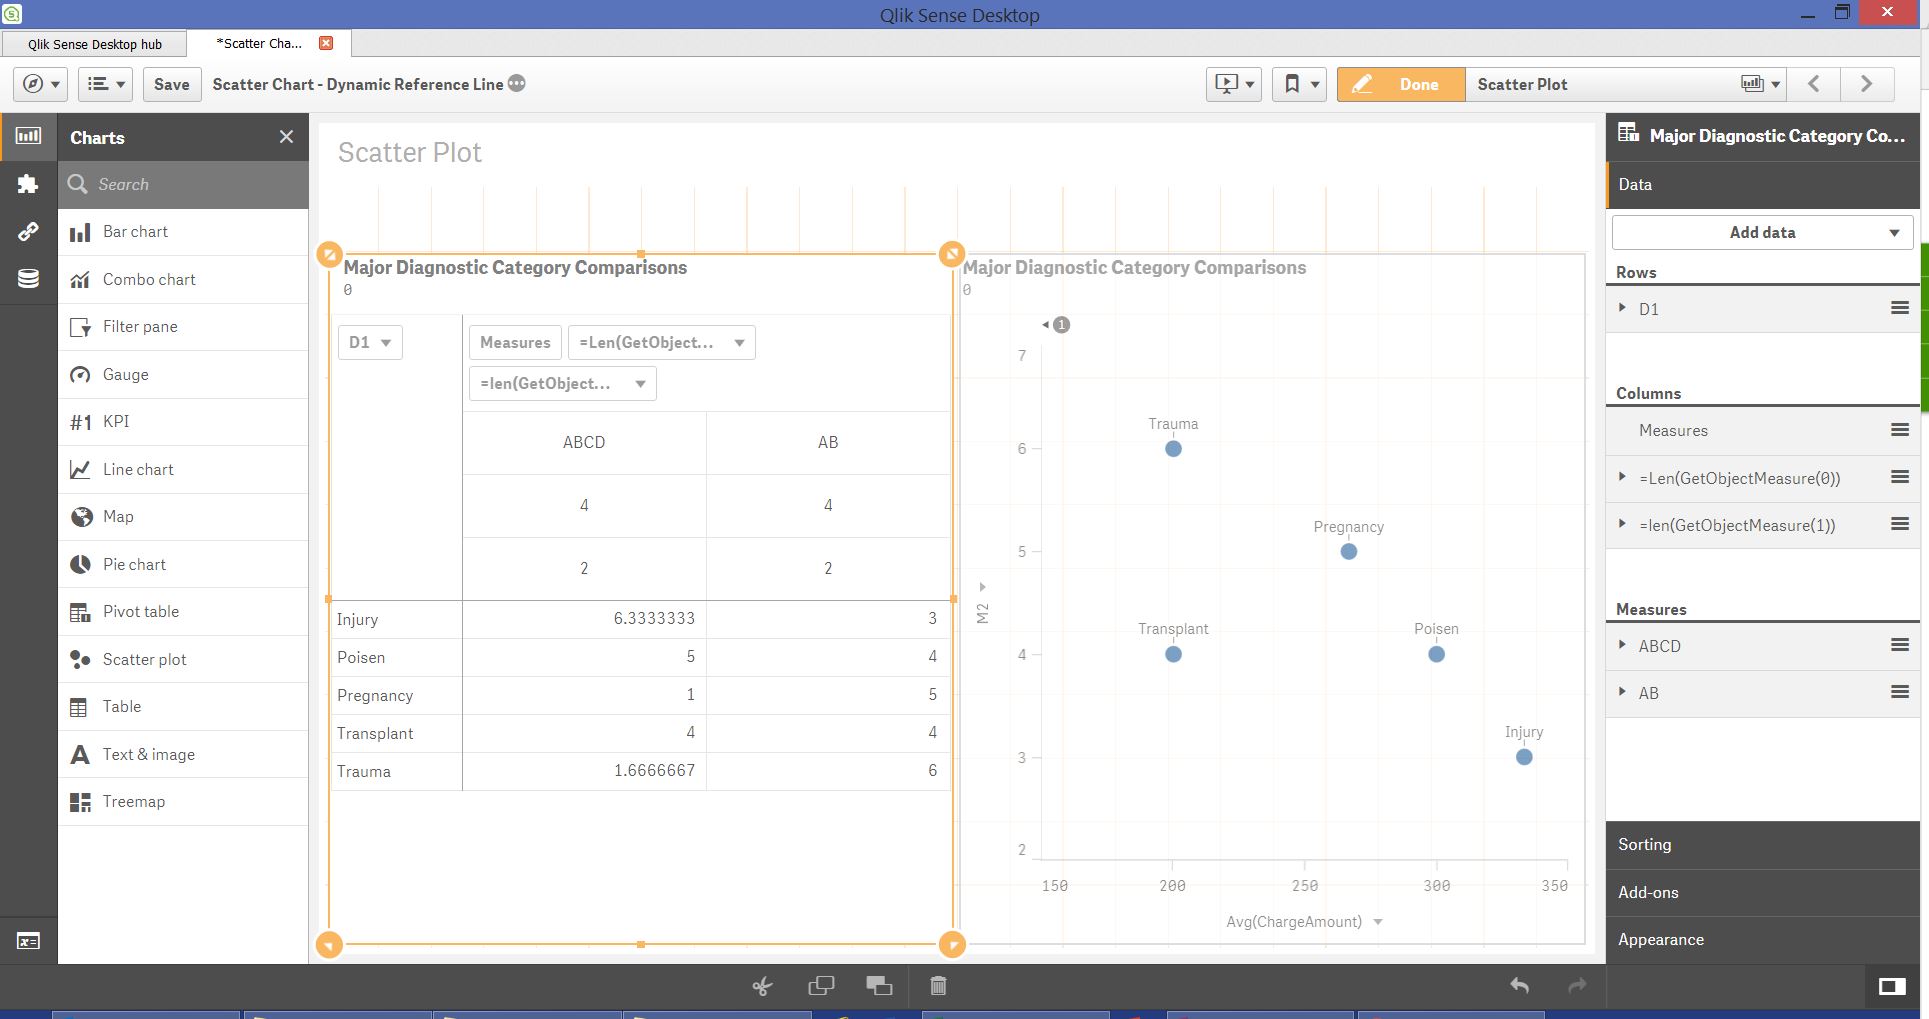
It works in the Pivot Table but somehow not when evaluating in the reference line expression. Please let us know if you can experiment a bit more and get it working.
thanks,
Ajit
- Mark as New
- Bookmark
- Subscribe
- Mute
- Subscribe to RSS Feed
- Permalink
- Report Inappropriate Content
Hi I'm looking into this as well
Any idea how to make the Reference line dynamically move according to the active view-able area of the chart instead of following the max Dimension
- Mark as New
- Bookmark
- Subscribe
- Mute
- Subscribe to RSS Feed
- Permalink
- Report Inappropriate Content
I need to know this as well. I want to change reference lines according to alternatively selected measures. Currently I have tried:
=If(SubStringCount(GetObjectMeasure(0), 'plano') >= 1, 1, 0)
which works fine in tables, tooltips, but not the Reference set expression.
- Mark as New
- Bookmark
- Subscribe
- Mute
- Subscribe to RSS Feed
- Permalink
- Report Inappropriate Content
I am also trying to solve this. It looks like you can not use the GetObjectMeasure() function as part of a reference line expression - see Qlik documentation here: https://help.qlik.com/en-US/sense/November2020/Subsystems/Hub/Content/Sense_Hub/ChartFunctions/Field...