Unlock a world of possibilities! Login now and discover the exclusive benefits awaiting you.
- Qlik Community
- :
- Forums
- :
- Analytics
- :
- New to Qlik Analytics
- :
- Qlik Sense bar chart legend sort required
- Subscribe to RSS Feed
- Mark Topic as New
- Mark Topic as Read
- Float this Topic for Current User
- Bookmark
- Subscribe
- Mute
- Printer Friendly Page
- Mark as New
- Bookmark
- Subscribe
- Mute
- Subscribe to RSS Feed
- Permalink
- Report Inappropriate Content
Qlik Sense bar chart legend sort required
I'm having trouble getting the legend to sort in the same way the data is for a chart:
my load script includes dual function as below:
IF("Est Vehicle speed during incident"='0-25 km',dual('0-25km/h',1),
IF("Est Vehicle speed during incident"='25-50 km',dual('25-50km/h',2),
IF("Est Vehicle speed during incident"='50-75 km',dual('50-75km/h',3),
IF("Est Vehicle speed during incident"='75-100 km',dual('75-100km/h',4),
IF("Est Vehicle speed during incident"='100-130 km',dual('100-130km/h',5))))))
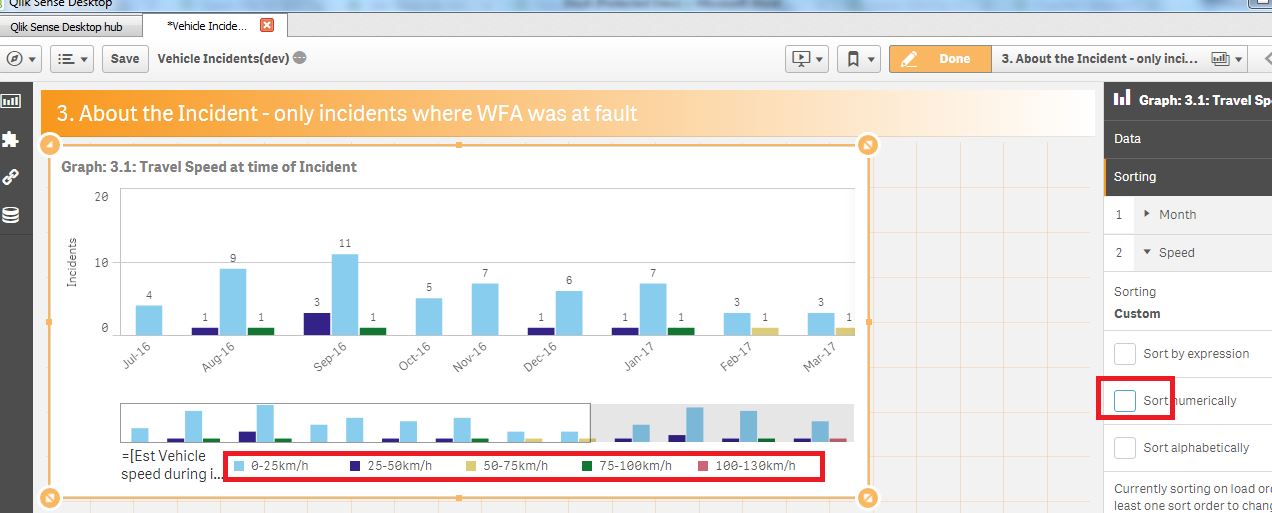
however the legend always shows with '75-100km/h' and '50-75km/h' in the wrong order i.e. I want ascending and the other values do show correctly in ascending order - I have it set under sorting to numerical/ascending.
The chart has a month dimension, and then the dimension above. The only measure is a count of ID's to get number of instances..
Please advise on options to try for this. Thanks.
- « Previous Replies
-
- 1
- 2
- Next Replies »
- Mark as New
- Bookmark
- Subscribe
- Mute
- Subscribe to RSS Feed
- Permalink
- Report Inappropriate Content
Hi,
Can you try like this?
Pick(Wildmatch([Est Vehicle speed during incident],'0-25 km','25-50 km','50-75 km','75-100 km','100-130 km','*'),
1,2,3,4,5,99)
Thanks,Deva
- Mark as New
- Bookmark
- Subscribe
- Mute
- Subscribe to RSS Feed
- Permalink
- Report Inappropriate Content
Thanks Dava,
but I still get a legend that doesn't read ascending, pic of chart is attached.
I used your code replacing mine in the load script and also as a sorting expression?
- Mark as New
- Bookmark
- Subscribe
- Mute
- Subscribe to RSS Feed
- Permalink
- Report Inappropriate Content
Hi,
Can your share your mock app? also you can try to define the buckets in the sort order you want in the script level like below. after that define SortID field at presentation chart - sort property (make sure unchecked other default sorting)
Dimension_SOrt:
LOAD * INLINE [
SortID,[Est Vehicle speed during incident]
1,0-25 km
2,25-50 km
3,50-75 km
4,75-100 km
5,100-130 km
];
Thanks,Deva
- Mark as New
- Bookmark
- Subscribe
- Mute
- Subscribe to RSS Feed
- Permalink
- Report Inappropriate Content
Hi Deva,
I had no luck with your further instructions.
attached is the original qvd file
many thanks
Gus
- Mark as New
- Bookmark
- Subscribe
- Mute
- Subscribe to RSS Feed
- Permalink
- Report Inappropriate Content
It may sound strange - but try to use the name Speed in the script instead of [Est Vehicle speed during incident2]. So the dimension definition in the chart will be just Speed.
- Mark as New
- Bookmark
- Subscribe
- Mute
- Subscribe to RSS Feed
- Permalink
- Report Inappropriate Content
thanks Michael. I didn't get any change by doing that, but attached is a new qvd with a manual solution at least.
After reading on another post that the legend is determined by the data load order, I added 5 dummy rows at the top of my excel data set and made sure there were in ascending order, as per my requirement.
As attached shows, this has indeed corrected the chart legend!
But for 13mth rolling charts and other data sets where directly linked to a database (rather than excel load), this isn't going to work?
Any suggestion for a generic script load that will do this?
thanks
- Mark as New
- Bookmark
- Subscribe
- Mute
- Subscribe to RSS Feed
- Permalink
- Report Inappropriate Content
Hi,
By unchecking Speed Sorting then it should work. refer below screen. Tks
- Mark as New
- Bookmark
- Subscribe
- Mute
- Subscribe to RSS Feed
- Permalink
- Report Inappropriate Content
thanks Deva. I understand by unticking the sort options, it then sorts by load order, but that still requires the dummy rows of ordered data on the follow up qvd I attached, correct?
I'm after a way to make this process more automatic, now that I've worked out how to manually order the legend.
cheers
- Mark as New
- Bookmark
- Subscribe
- Mute
- Subscribe to RSS Feed
- Permalink
- Report Inappropriate Content
Hi,
Still requires the dummy rows of ordered data on the follow up qvd I attached, ?
I don't find any qvd, in your Sense .qvf file i can see only your excel source and inline load.
In your case, you just use like below Sorting function at back end and enable custom sorting - front end
Data:
LOAD
ID,
"Incident Date and Time",
"Est Vehicle speed during incident",
Pick(Wildmatch([Est Vehicle speed during incident],'0-25 km','25-50 km','50-75 km','75-100 km','100-130 km','*'),
1,2,3,4,5,99)
as Speed,
"Month",
"At Fault"
FROM [lib://QlikSense server general data depository (corp_gusfe)/Vehicle Incidents Qlik2.xlsx]
(ooxml, embedded labels, table is Incidents);
Tks,Deva
- « Previous Replies
-
- 1
- 2
- Next Replies »