Unlock a world of possibilities! Login now and discover the exclusive benefits awaiting you.
- Qlik Community
- :
- Forums
- :
- Analytics
- :
- New to Qlik Analytics
- :
- Qlik Sense date and time - all 12 months on a char...
- Subscribe to RSS Feed
- Mark Topic as New
- Mark Topic as Read
- Float this Topic for Current User
- Bookmark
- Subscribe
- Mute
- Printer Friendly Page
- Mark as New
- Bookmark
- Subscribe
- Mute
- Subscribe to RSS Feed
- Permalink
- Report Inappropriate Content
Qlik Sense date and time - all 12 months on a chart
Hi, I have a bar chart with month and amount; but the xasis has only months that has the data. How can I fix it so that it shows all 12 months? (From 2014/5 - 2015/5, for example)
I tried with the method from this blog
I put the calendar definition in the data load editor but when I reload and check the date and time section in the fields, I still don't get anything. How can I fix it?
- « Previous Replies
-
- 1
- 2
- Next Replies »
- Mark as New
- Bookmark
- Subscribe
- Mute
- Subscribe to RSS Feed
- Permalink
- Report Inappropriate Content
Have you set up the field to show null values?
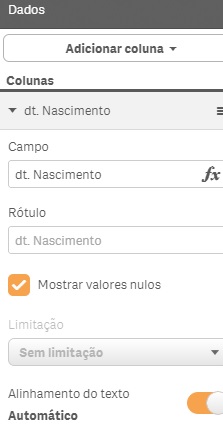
See image below
Data--> Columns--> Show null values
- Mark as New
- Bookmark
- Subscribe
- Mute
- Subscribe to RSS Feed
- Permalink
- Report Inappropriate Content
Yes, it is set to show null values.
- Mark as New
- Bookmark
- Subscribe
- Mute
- Subscribe to RSS Feed
- Permalink
- Report Inappropriate Content
if you don't have the months in your data set you need to add them to the data source OR, you can have qlik generate in he load script. The latter would be a dynamic solution that I would recommend .
- Mark as New
- Bookmark
- Subscribe
- Mute
- Subscribe to RSS Feed
- Permalink
- Report Inappropriate Content
Jonathan,
I have added calendar script in the data editor, referred from the date and time blog (below). Is this what you mean?
Calendar:
Declare Field Definition Tagged '$date'
Parameters
first_month_of_year = 1
Fields
Year($1) as Year Tagged '$year',
Month($1) as Month Tagged '$month',
Date($1) as Date Tagged ('$date', '$day'),
Week($1) as Week Tagged '$week'
Groups
Year, Month, Date type collection as YearMonthDate;
Derive Fields from Fields ExpenseDate Using Calendar;
- Mark as New
- Bookmark
- Subscribe
- Mute
- Subscribe to RSS Feed
- Permalink
- Report Inappropriate Content
hi seona
Please take a look at this video it should explain how to create and use a master calendar and solve your problem.
In regards to what you are using that is not a really good example of a master calendar.
It does not fill in all of the missing data it just derives New fields from existing dates
Understanding the Master Calendar (video)
Please mark the appropriate discussion thread as helpful or correct so our team knows that your question has been answered to your satisfaction
Regards,
Mike T
QLik
Mike Tarallo
Qlik
- Mark as New
- Bookmark
- Subscribe
- Mute
- Subscribe to RSS Feed
- Permalink
- Report Inappropriate Content
no, that script won't populate missing dates, months... it just forms the common date buckets that most people want from a date field.
Here is a sample below where i loop between the years of the min and max date and create a table that links to the main table with dates.
RawData:
load * inline [
Month,Sales
201501,100
201502,50
201401,75
201403,25
201509,120
201406,30
201506,15];
SalesData:
load
Date(Date#(Month,'YYYYMM')) as Date,
Sales
resident RawData;
drop table RawData;
MinMaxTable:
load distinct Date(min(Date)) as minDate, Date(max(Date)) as maxDate resident SalesData;
let vMinDate=peek('minDate',0,'MinMaxTable');
let vMaxDate=peek('maxDate',0,'MinMaxTable');
let vYears=Year(vMaxDate)-Year(vMinDate);
drop table MinMaxTable;
for vYear=0 to $(vYears)
let vMakeYear=Year('$(vMinDate)')+$(vYear);
Months:
Load
makedate( $(vMakeYear),recno()) as Date
autogenerate 12;
next vYear;
- Mark as New
- Bookmark
- Subscribe
- Mute
- Subscribe to RSS Feed
- Permalink
- Report Inappropriate Content
Hi Michael,
I tried with the instruction above and I get the following error
The error occurred here:
Temp: Load min(ClosingDate) as minDate, max(ClosingDate) as maxDate Resident Pipeline 05 29 2015 v.2
The date field is called 'Closing Date' and it shows as [Closing Date] on the default main data load editor. I tried using the same format [ ] and it still does not work. Also, for the Pipeline 05 29 2015 v.2 (next to 'Resident') is the name of the file. Am i supposed to put the name of the file next to 'Resident'?
- Mark as New
- Bookmark
- Subscribe
- Mute
- Subscribe to RSS Feed
- Permalink
- Report Inappropriate Content
Hi Jonathan,
I have a lost list of data and is there a way to generate such list below automatically?
RawData:
load * inline [
Month,Sales
201501,100
201502,50
201401,75
201403,25
201509,120
201406,30
201506,15];
- Mark as New
- Bookmark
- Subscribe
- Mute
- Subscribe to RSS Feed
- Permalink
- Report Inappropriate Content
Not certain i understand. You can certainly manufacture some random data in Qlik to provide many more rows using the rand() function and the autogenerate command in a load. The following randomizes dates over the last 10 years and randomizes sales numbers from 0 to 1000 each. Is that what you are looking for ?
RandomData:
load
makedate( floor(rand()*10) + year(today())-9, floor(rand() * 12)+1 ) as Date,
num(rand()*1000,'#,###.#0') as Sales
autogenerate 1000;
Months:
Load
Date,
Year(Date) as Year,
Month(Date) as Month
resident RandomData;
- « Previous Replies
-
- 1
- 2
- Next Replies »