Unlock a world of possibilities! Login now and discover the exclusive benefits awaiting you.
- Qlik Community
- :
- Forums
- :
- Analytics
- :
- New to Qlik Analytics
- :
- QlikSense Dimension: show all values like QlikView...
- Subscribe to RSS Feed
- Mark Topic as New
- Mark Topic as Read
- Float this Topic for Current User
- Bookmark
- Subscribe
- Mute
- Printer Friendly Page
- Mark as New
- Bookmark
- Subscribe
- Mute
- Subscribe to RSS Feed
- Permalink
- Report Inappropriate Content
QlikSense Dimension: show all values like QlikView?
Hello,
if there a possibility to do something like "Show all Values" in QlikView on the dimension definition for a diagramm?
In QlikSense i found only "Show null values".
My goal is to have a "fixed" dimension with all fiel dvalues, even if it selected or not. Like i can do it in QlikView.
Regards, Henry
- « Previous Replies
-
- 1
- 2
- Next Replies »
Accepted Solutions
- Mark as New
- Bookmark
- Subscribe
- Mute
- Subscribe to RSS Feed
- Permalink
- Report Inappropriate Content
You can trick Qlik Sense to show all values by using a different Measure. For instance, if you want to show
Sum( Sales )
then you can use the following expression instead:
Sum( Sales ) + 0 * Sum( {1} Sales )
The Set Analysis in the second term will force Qlik Sense to show all values, but since you multiply it by zero, the value will still be the correct one.
HIC
- Mark as New
- Bookmark
- Subscribe
- Mute
- Subscribe to RSS Feed
- Permalink
- Report Inappropriate Content
Hello Henric,
thanks for your help. It works fine. 
Regards, Henry
- Mark as New
- Bookmark
- Subscribe
- Mute
- Subscribe to RSS Feed
- Permalink
- Report Inappropriate Content
Hi Henric,
Mine is the same requirement,
It's working when I use Sum( Sales ) + 0 * Sum( {1} Sales )
But when Use this in combo chart to show the linear trend line, it's showing as gaps as In screen shot.
Can you please help me in resolving this.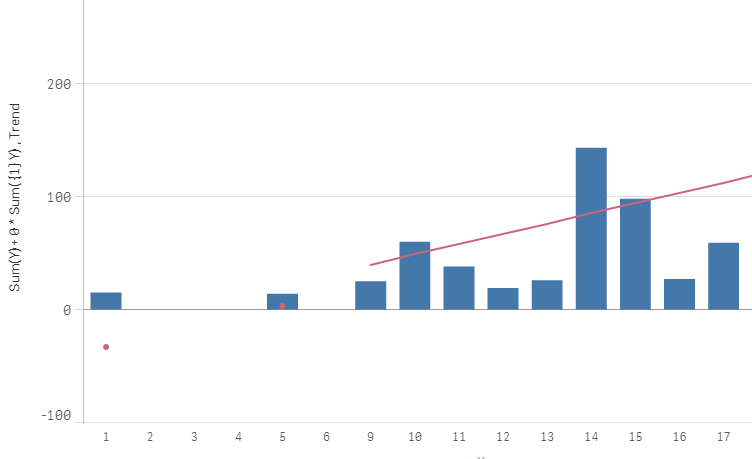
- Mark as New
- Bookmark
- Subscribe
- Mute
- Subscribe to RSS Feed
- Permalink
- Report Inappropriate Content
hic Hi Henric, but this trick is not working for me in Qlikview 12(SR4). Please see my problem below.
I have two fields, say
Table1: Field1,Name with values A,B,C,D
Table2: Field1,Date,Amount (Transactional Data Table but having values only for A,B,and C and it will never have values for D)
I am now making a Straight Table Chart with Dimension Field1 and Expression as if(Field1<>'D',Sum(Amount),some sum formula for D's value). But the problem is it's not showing value for D because there is no value for D in Table2. "Show All Values" is also not working.
Note:Formula above is written in narrative form for simplicity.
Please advise.
Thanks and BR,
SAK
- Mark as New
- Bookmark
- Subscribe
- Mute
- Subscribe to RSS Feed
- Permalink
- Report Inappropriate Content
Hi Henrick,
I have a dimension called countries.
A filter date and some time slots :YTD MTD and so on .
if I select date =31/12/2016 and MTD;
in my filter Countries, I will only have available one country (since the others have not done anything in the selected date)
This does not affect my graphics (since in the expressions,the KPI is independant of the date selection) but only affects my list selection (countries)
What can I do to force a list selection made of one dimension 'countries' to show all of my countries independant of the selection of a date:
with a set expression, I can simply do : {<date=>}, but since countries is a string, I can't use any aggregation; thus I couldn't find a solution !
Hope the issue is rather clear;
Thanks !
- Mark as New
- Bookmark
- Subscribe
- Mute
- Subscribe to RSS Feed
- Permalink
- Report Inappropriate Content
I suggest you open a separate thread for this question, and post a document that shows your question.
HIC
- Mark as New
- Bookmark
- Subscribe
- Mute
- Subscribe to RSS Feed
- Permalink
- Report Inappropriate Content
Henric,
Thank you. I noticed this behavior and was in the process of determining the proper course of action when selecting dimensions in any of the data tables associated with the Master Calendar.
Your solution is both simple and logical. I've been able to modify the measures in any chart visualization to allow the master calendar dates to display regardless of the selection that has been made.
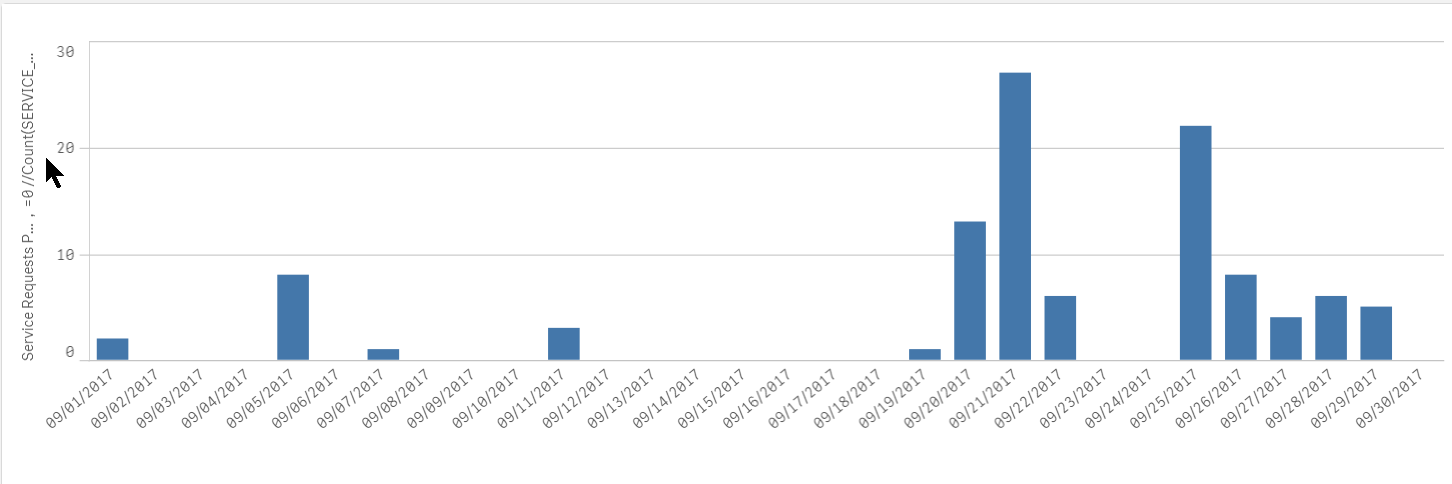
However, I've a question about QS behavior when a selection is made. My app has a bar chart that reports on the number of service requests processed. If a date range is selected, the measure Count(SERVICE_REQUEST)+0*Count({1}SERVICE_REQUEST) returns all dates in the master calendar (as it should). Since the solution will have ~18 months of data, and the visualization requirement is to show the requests processed by individual for a given month there is a need to limit the dimension to one month of that range (or less).
I experimented with the measure, trying:
Count(SERVICE_REQUEST)+0*Count({$}SERVICE_REQUEST)
which gives the proper result when selecting a date range:
When a selection is made (for example, selecting one of the individuals responsible for processing service requests), that expression loses the master calendar (also as expected)
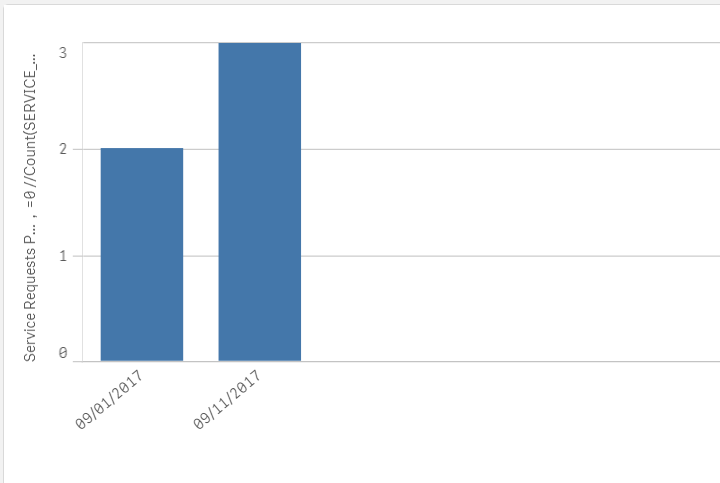
Can you suggest an expression for the measure that will retain the master calendar dates for a given date range when a selection is made?
Thanks in advance
Frank.
- Mark as New
- Bookmark
- Subscribe
- Mute
- Subscribe to RSS Feed
- Permalink
- Report Inappropriate Content
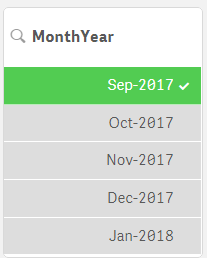
I would probably try something like
Count(SERVICE_REQUEST) +
0*Count({1<MonthYear={"$(=Date(Max(MonthYear),'MMM-YYYY'))"}>}SERVICE_REQUEST)
Then it would return all dates in the last month, irrespective of selection.
HIC
- Mark as New
- Bookmark
- Subscribe
- Mute
- Subscribe to RSS Feed
- Permalink
- Report Inappropriate Content
Henric,
Thank you. That worked perfectly once I adjusted the expression for the trend line to return only the selected values.
That was so because the expression that Mike Tarallo had posted in How to add lineal trend in Qlik sense:
linest_m(total aggr(if(sum(Sales),sum(Sales)),OrderDate),OrderDate)*
only({1}OrderDate)+linest_b(total aggr(if(sum(Sales),sum(Sales)),OrderDate),OrderDate)
returned all dates in the order clause. Once I changed that to only({$}OrderDate) the combo chart worked properly.
Frank.
- « Previous Replies
-
- 1
- 2
- Next Replies »