Unlock a world of possibilities! Login now and discover the exclusive benefits awaiting you.
- Qlik Community
- :
- Forums
- :
- Analytics
- :
- New to Qlik Analytics
- :
- Re: [Qliksense] How can i display 2 dimensions on ...
- Subscribe to RSS Feed
- Mark Topic as New
- Mark Topic as Read
- Float this Topic for Current User
- Bookmark
- Subscribe
- Mute
- Printer Friendly Page
- Mark as New
- Bookmark
- Subscribe
- Mute
- Subscribe to RSS Feed
- Permalink
- Report Inappropriate Content
[Qliksense] How can i display 2 dimensions on the X axis (e.g. period on top, date for the period below)
Hi All,
I am still new to Qliksense, thus I would need some help here.
Would appreciate if anyone can help me on this?
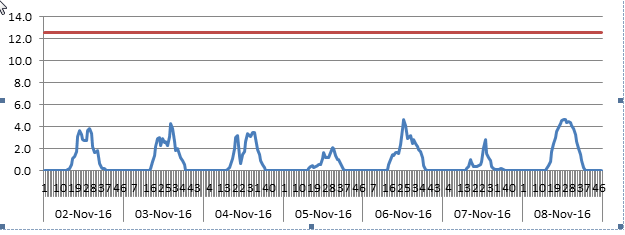
Sample of how the final chart should look like.
Period on top of the date as per the screenshot:
Thanks!
- Mark as New
- Bookmark
- Subscribe
- Mute
- Subscribe to RSS Feed
- Permalink
- Report Inappropriate Content
You can't. The standard line chart object in Qlik Sense supports only one dimension for the x-axis. But if you have a datetime (aka timestamp) dimension you can use that and Qlik Sense will automatically show the appropriate unit when you zoom in.
talk is cheap, supply exceeds demand
- Mark as New
- Bookmark
- Subscribe
- Mute
- Subscribe to RSS Feed
- Permalink
- Report Inappropriate Content
For our case, for each date we having 48 periods. Thus would like to check if it is possible to display the period above the date on the X axis? Or is there any extension tools which can help me to achieve this?
Thanks in advance!
- Mark as New
- Bookmark
- Subscribe
- Mute
- Subscribe to RSS Feed
- Permalink
- Report Inappropriate Content
you split it into two fields and define it as master item with drill down
- Mark as New
- Bookmark
- Subscribe
- Mute
- Subscribe to RSS Feed
- Permalink
- Report Inappropriate Content
Hi Lakshmikandh,
Thanks for the help.
I tried drill down, but the chart display on X axis, do did not display both Period and Date, with the date on top of Date.
Did I do anything wrong?
Appreciate your help!
Regards.
- Mark as New
- Bookmark
- Subscribe
- Mute
- Subscribe to RSS Feed
- Permalink
- Report Inappropriate Content
it will not display both when you select on an a particular date, it will drill to periods for that date
- Mark as New
- Bookmark
- Subscribe
- Mute
- Subscribe to RSS Feed
- Permalink
- Report Inappropriate Content
I understand. Thanks.
However, is there a way in which I can achieve that?
Appreciate it.
Regard.
- Mark as New
- Bookmark
- Subscribe
- Mute
- Subscribe to RSS Feed
- Permalink
- Report Inappropriate Content
Gwo,
If you are okay to use bar chart instead, you can get it to work with a simple bar chart, (grouped and not stacked, vertical) with two dimensions and one measure will get you this.
hope this helps,
thanks,
Ajit