Unlock a world of possibilities! Login now and discover the exclusive benefits awaiting you.
- Qlik Community
- :
- Forums
- :
- Analytics
- :
- New to Qlik Analytics
- :
- Re: Qliksense Line Charts showing zero values
- Subscribe to RSS Feed
- Mark Topic as New
- Mark Topic as Read
- Float this Topic for Current User
- Bookmark
- Subscribe
- Mute
- Printer Friendly Page
- Mark as New
- Bookmark
- Subscribe
- Mute
- Subscribe to RSS Feed
- Permalink
- Report Inappropriate Content
Qliksense Line Charts showing zero values
Hi There,
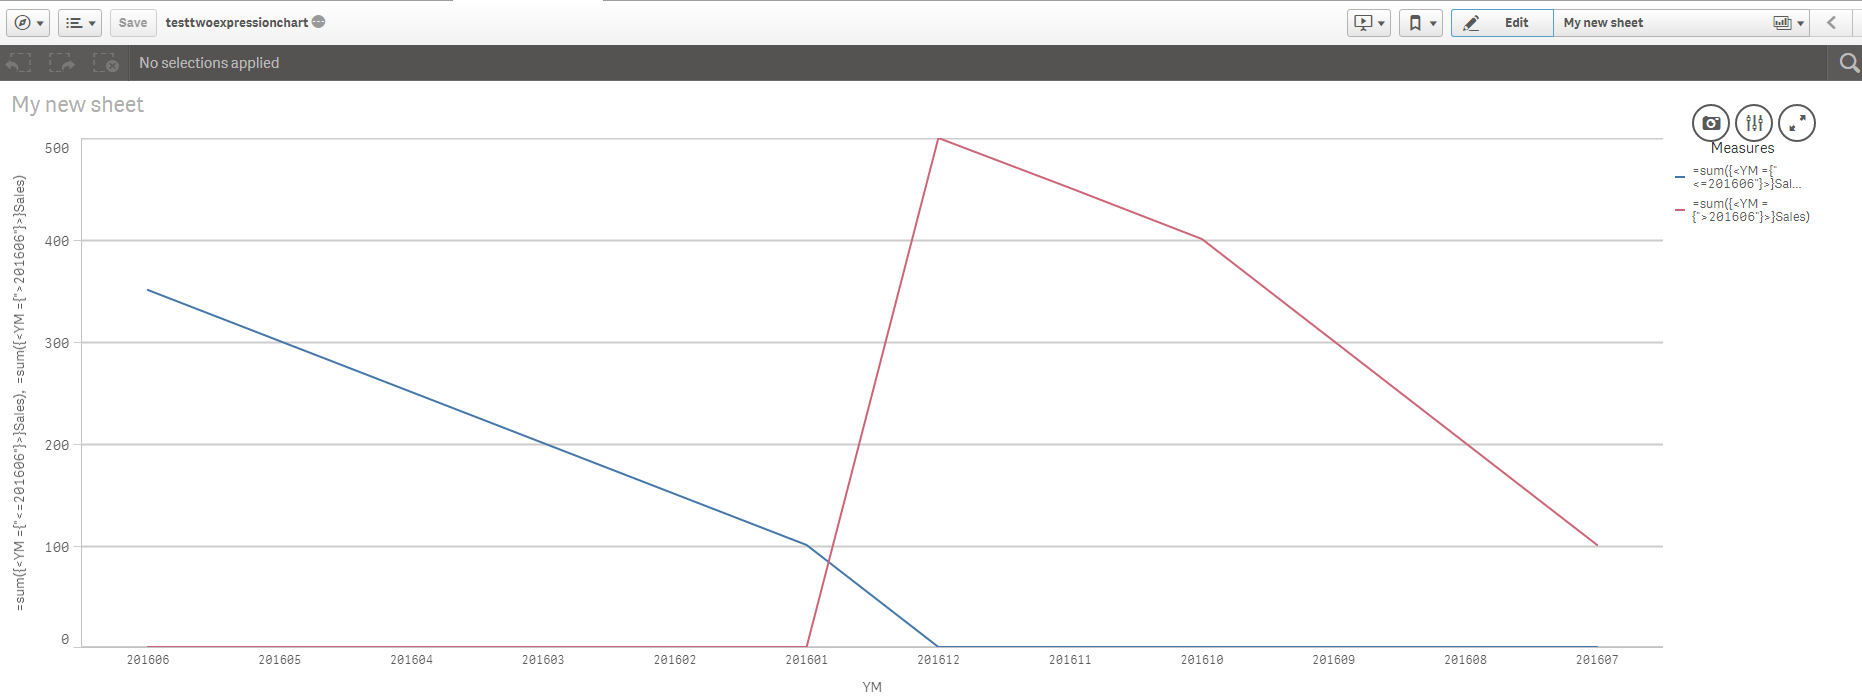
I'm trying to find a way to deal with the way Qlik Sense seems to handle zero values in a line chart. in the below chart,Sense seems to plot the zero values in the chart. This leads to a strange looking chart like the one below with the overlapping line. Is there something I can set on the chart to avoid this without changing the expression? I've attached the QVF for the below image.
- Mark as New
- Bookmark
- Subscribe
- Mute
- Subscribe to RSS Feed
- Permalink
- Report Inappropriate Content
Hi Nathan,
I don't think there is anything "out of the box" that could eliminate zeros from being plotted. The work-around that I'd use is to replace zeros with nulls, using a simple IF condition. See attached
Cheers,
Oleg Troyansky
Upgrade your Qlik skills at the Masters Summit for Qlik - coming to Boston, MA this October!
- Mark as New
- Bookmark
- Subscribe
- Mute
- Subscribe to RSS Feed
- Permalink
- Report Inappropriate Content
Thanks Oleg. I had been hoping to avoid nulling the else conditions as I didn't want to add additional complexity to the expressions (in the app we're porting to Sense the underlying expression is already quite complex), but I think we may end up just nulling these or switching to a bar chart.