Unlock a world of possibilities! Login now and discover the exclusive benefits awaiting you.
- Qlik Community
- :
- Forums
- :
- Analytics
- :
- New to Qlik Analytics
- :
- Re: Ranking multiple dimensions
- Subscribe to RSS Feed
- Mark Topic as New
- Mark Topic as Read
- Float this Topic for Current User
- Bookmark
- Subscribe
- Mute
- Printer Friendly Page
- Mark as New
- Bookmark
- Subscribe
- Mute
- Subscribe to RSS Feed
- Permalink
- Report Inappropriate Content
Ranking multiple dimensions
Hi there.
I've using Qlikview for two weeks and QSense for two more, so firstly I apologize if something results obvious.
The problem is as it follows:
I'm working on a dashboad that have been built from a poll in xlxs format (excel), so I'd like to represent several rankings.
For instance, we have some reasons for leaving the company as a client. That client could have chosen one or more reasons, and the reasons are collected in the excel file as columns. When I try to build up a bar chart, Sense considers each reason (column) as a dimenson, then I'm only able to represent one per chart and, of course, manually sorted. This is what I've got:
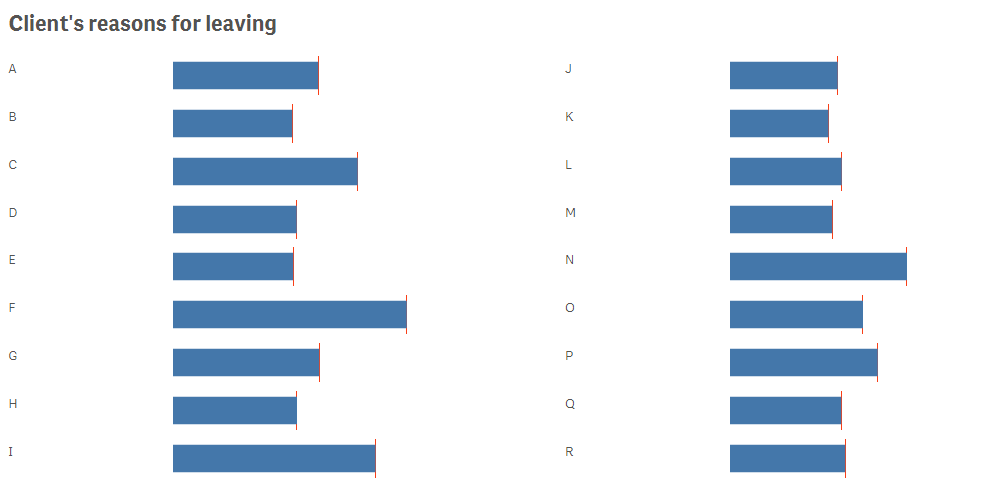
I've only reached to this partial solution, one bar chart per reason (A,B,C...) showed as a unique bar.
Any sugestion for impleting it as one complete chart, for dynamic sorting and so on?
Thank you so much for any help : D
Accepted Solutions
- Mark as New
- Bookmark
- Subscribe
- Mute
- Subscribe to RSS Feed
- Permalink
- Report Inappropriate Content
Hi again.
Sorry for responding a bit late, but I had some other issues on the 'to do' pile.
Finally I could solved it using the function crosstable().
Thank you guyz.
- Mark as New
- Bookmark
- Subscribe
- Mute
- Subscribe to RSS Feed
- Permalink
- Report Inappropriate Content
Guess no chance on building this up :S
- Mark as New
- Bookmark
- Subscribe
- Mute
- Subscribe to RSS Feed
- Permalink
- Report Inappropriate Content
Provide post sample data in excel and clearly mention your requirement in details
- Mark as New
- Bookmark
- Subscribe
- Mute
- Subscribe to RSS Feed
- Permalink
- Report Inappropriate Content
Perhaps:
[All_Data]:
LOAD
ID,
Col1,
Col2,
Col3
FROM [yourExcelFile];
LOAD
ID,
Col1 AS Reason
RESIDENT All_Data;
CONCATENATE
LOAD
ID,
Col2 AS Reason
RESIDENT All_Data;
CONCATENATE
LOAD
ID,
Col3 AS Reason
RESIDENT All_Data;
DROP TABLE All_Data;
- Mark as New
- Bookmark
- Subscribe
- Mute
- Subscribe to RSS Feed
- Permalink
- Report Inappropriate Content
Please load sample data not, script.
- Mark as New
- Bookmark
- Subscribe
- Mute
- Subscribe to RSS Feed
- Permalink
- Report Inappropriate Content
Hi again.
Sorry for responding a bit late, but I had some other issues on the 'to do' pile.
Finally I could solved it using the function crosstable().
Thank you guyz.