Unlock a world of possibilities! Login now and discover the exclusive benefits awaiting you.
- Qlik Community
- :
- Forums
- :
- Analytics
- :
- New to Qlik Analytics
- :
- Re: Relative Values in Bar Chart
- Subscribe to RSS Feed
- Mark Topic as New
- Mark Topic as Read
- Float this Topic for Current User
- Bookmark
- Subscribe
- Mute
- Printer Friendly Page
- Mark as New
- Bookmark
- Subscribe
- Mute
- Subscribe to RSS Feed
- Permalink
- Report Inappropriate Content
Relative Values in Bar Chart
Hi Guys,
How can I show relative values against primary dimension in the Qlik Sense Bar Chart ?
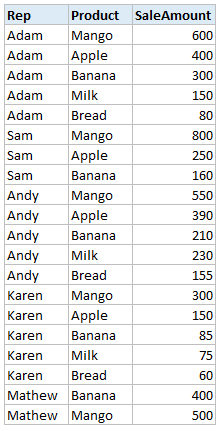
About the Data
I have a very simple data set as shown below. I have also attached spreadsheet with this sample data.
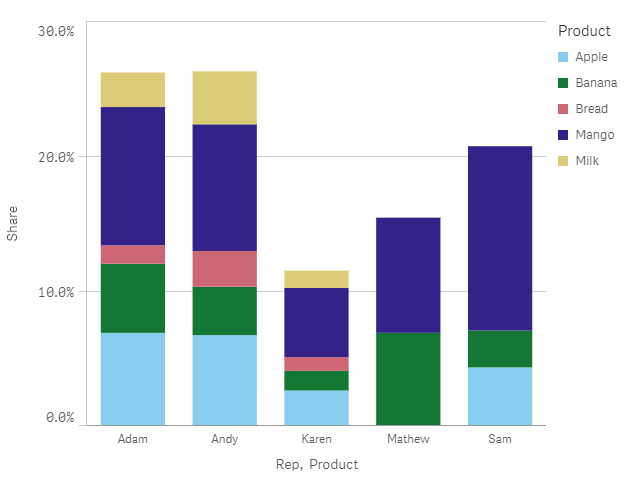
Problem
I am using Rep & Product as Dimensions and =Num(sum(SaleAmount) / sum(TOTAL SalAmount),'0.0%') as measure.
But I get the following Chart.
What I am trying to achieve?
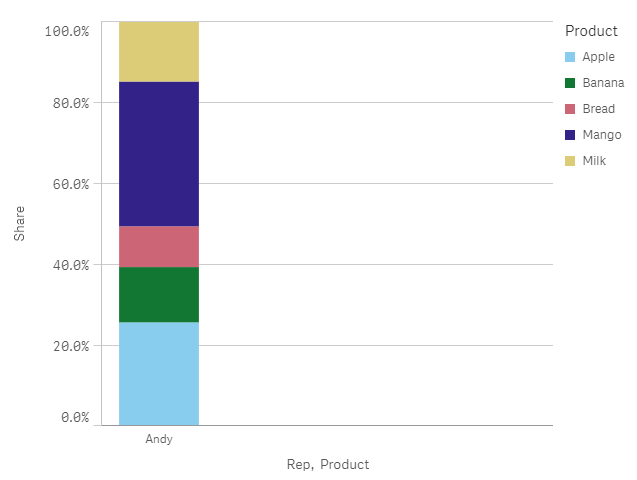
I want to see every bar at 100% Level so I can compare relative share against each sales rep.
Right now when I filter data at a single Sales Rep level then I get the desire bar chart but it will only show one rep because I have applied filter.
I would like the below bar for all the reps.
Thank you in advance 
- « Previous Replies
-
- 1
- 2
- Next Replies »
Accepted Solutions
- Mark as New
- Bookmark
- Subscribe
- Mute
- Subscribe to RSS Feed
- Permalink
- Report Inappropriate Content
- Mark as New
- Bookmark
- Subscribe
- Mute
- Subscribe to RSS Feed
- Permalink
- Report Inappropriate Content
Try this:
=Num(Sum(SaleAmount) / Sum(TOTAL <Rep> SalAmount),'0.0%')
- Mark as New
- Bookmark
- Subscribe
- Mute
- Subscribe to RSS Feed
- Permalink
- Report Inappropriate Content
Thank you Sunny,
It Worked. But the Y axis now shows up to 150% !
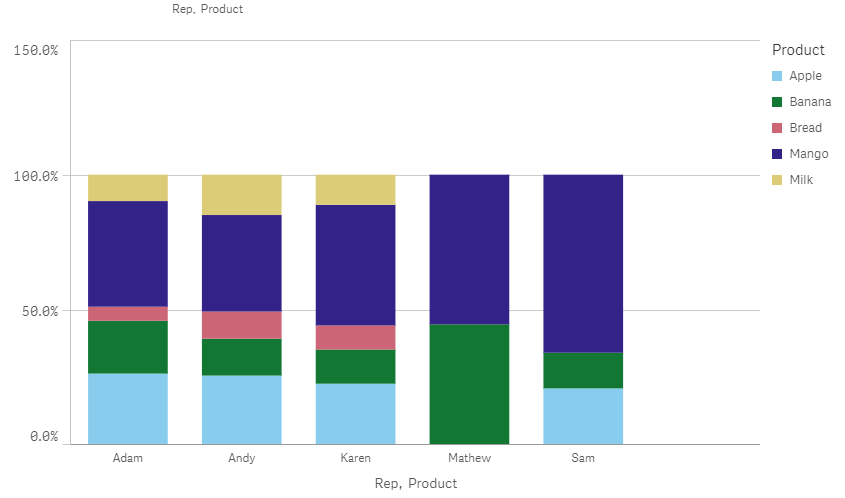
Could it be because some sales reps only have few products ?
- Mark as New
- Bookmark
- Subscribe
- Mute
- Subscribe to RSS Feed
- Permalink
- Report Inappropriate Content
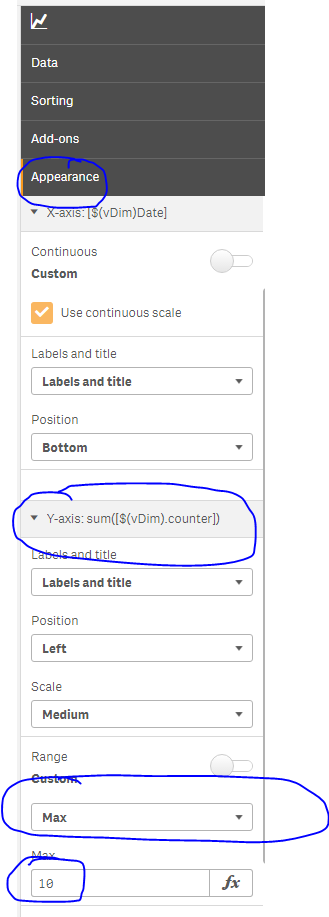
You can set the axis to Max = 1
- Mark as New
- Bookmark
- Subscribe
- Mute
- Subscribe to RSS Feed
- Permalink
- Report Inappropriate Content
Thanks sunny
- Mark as New
- Bookmark
- Subscribe
- Mute
- Subscribe to RSS Feed
- Permalink
- Report Inappropriate Content
Hello!
Can this be done if instead of rep, I have a "drill down"?
Like Country/city
If I'm at the country level, the formulas will work if I use <Country> but when I zoom in the City level, the formula does not work anymore :S
Any idea?
- Mark as New
- Bookmark
- Subscribe
- Mute
- Subscribe to RSS Feed
- Permalink
- Report Inappropriate Content
See if Jonathan's response help you figure out the dimension
Re: QLIK SENSE: $(=GetCurrentField(Time))
If you are able to find the name of the dimension, you should be able to include that within <>.
- Mark as New
- Bookmark
- Subscribe
- Mute
- Subscribe to RSS Feed
- Permalink
- Report Inappropriate Content
Hi,
Thanks a lot, that seems perfect!
Only problem I have is that my variable $vGetCurrentLocalisationFields seems to not be recognized in the expression as a field name:
$(vGetCurrentLocalisationFields) = country
aggr(Sum(quantity),country) does work but
aggr(Sum(quantity),$(vGetCurrentLocalisationFields)) does not....
- Mark as New
- Bookmark
- Subscribe
- Mute
- Subscribe to RSS Feed
- Permalink
- Report Inappropriate Content
You might need an equal sign
aggr(Sum(quantity),$(=vGetCurrentLocalisationFields))
- Mark as New
- Bookmark
- Subscribe
- Mute
- Subscribe to RSS Feed
- Permalink
- Report Inappropriate Content
I've try taht but it did not work either
- « Previous Replies
-
- 1
- 2
- Next Replies »