Unlock a world of possibilities! Login now and discover the exclusive benefits awaiting you.
- Qlik Community
- :
- Forums
- :
- Analytics
- :
- New to Qlik Analytics
- :
- Re: Removal of double counting
- Subscribe to RSS Feed
- Mark Topic as New
- Mark Topic as Read
- Float this Topic for Current User
- Bookmark
- Subscribe
- Mute
- Printer Friendly Page
- Mark as New
- Bookmark
- Subscribe
- Mute
- Subscribe to RSS Feed
- Permalink
- Report Inappropriate Content
Removal of double counting
We have downloaded government contract data into Excel and uploaded to Qlik Sense. It shows contract information. Each row shows information to an update to an existing contract. For example, 5 consecutive rows can show 6 annual updates for 1 contract (see highlighted rows in attached)
Our goal is to count the “Contract Office Name” only once per specific contract “Contract ID”. We want to have a pie graph representing the percentage of each Contracting Office Name but can't figure out how to use the functions to not double count with respect to the contract updates.
Thank you!.png)
- Mark as New
- Bookmark
- Subscribe
- Mute
- Subscribe to RSS Feed
- Permalink
- Report Inappropriate Content
have you tried making the "Contract Office Name" your dimension and count(distinct "contract ID") as your expression?
- Mark as New
- Bookmark
- Subscribe
- Mute
- Subscribe to RSS Feed
- Permalink
- Report Inappropriate Content
I tried inputting that and it said "The chart is not displayed because it contains only negative or zero values"
- Mark as New
- Bookmark
- Subscribe
- Mute
- Subscribe to RSS Feed
- Permalink
- Report Inappropriate Content
An efficient way would be to modify your load script and add a table to hold unique ContractID's
YourDataTable
LOAD *
FROM Xxxxxxxxx;
LOAD
DISTINCT ContractID,
1 as ID_Count
RESIDENT YourDataTable;
Now your expression will be = sum(ID_Count) <<Sum works faster than Count
Cheers
V
If a post helps to resolve your issue, please accept it as a Solution.
- Mark as New
- Bookmark
- Subscribe
- Mute
- Subscribe to RSS Feed
- Permalink
- Report Inappropriate Content
Can you provide a screenshot?
- Mark as New
- Bookmark
- Subscribe
- Mute
- Subscribe to RSS Feed
- Permalink
- Report Inappropriate Content
It was an error with parenthesis. I wrote it as count(distinct [Contracting Agency ID])
- Mark as New
- Bookmark
- Subscribe
- Mute
- Subscribe to RSS Feed
- Permalink
- Report Inappropriate Content
Sarah,
count(distinct [Contracting Agency ID]) is syntactically correct. Is it working now?
- Mark as New
- Bookmark
- Subscribe
- Mute
- Subscribe to RSS Feed
- Permalink
- Report Inappropriate Content
I think so. is there a way to have it display more fields instead of "other"?.png)
- Mark as New
- Bookmark
- Subscribe
- Mute
- Subscribe to RSS Feed
- Permalink
- Report Inappropriate Content
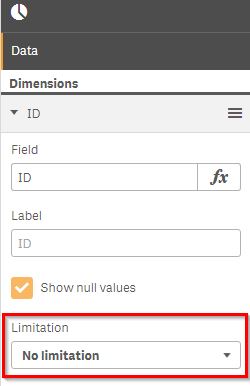
I think you have a dimension limitation set to 10.
Check the dimension limit under the dimension tab. You'll want to set the Limitation drop down to No Limitation
