Unlock a world of possibilities! Login now and discover the exclusive benefits awaiting you.
- Qlik Community
- :
- Forums
- :
- Analytics
- :
- New to Qlik Analytics
- :
- Re: Restrict Range using a function
- Subscribe to RSS Feed
- Mark Topic as New
- Mark Topic as Read
- Float this Topic for Current User
- Bookmark
- Subscribe
- Mute
- Printer Friendly Page
- Mark as New
- Bookmark
- Subscribe
- Mute
- Subscribe to RSS Feed
- Permalink
- Report Inappropriate Content
Restrict Range using a function
Hello Folks,
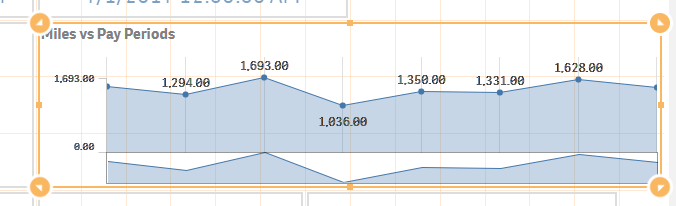
I have a line chart, and the default range for the chart is way to high. The measure of the chart is "SUM(ord_totalmiles)" so I thought that using "SUM(ord_totalmiles) * 1.2" would bring it down to acceptable levels. However, the selections that are being made don't seem to be influencing this sum. How do I say in Qlik "Take the max sum (sum of miles) of the dimension (pay period) in question based on the other selections in the chart (the driver the user has chosen), and then multiply that by 1.2".
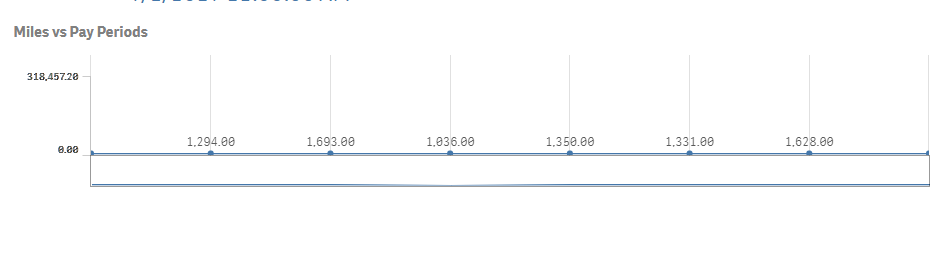
Here is a picture of the chart showing the problem, I've selected a Driver, yet the range is 300K+ when the max value is only around 1.6K.
Accepted Solutions
- Mark as New
- Bookmark
- Subscribe
- Mute
- Subscribe to RSS Feed
- Permalink
- Report Inappropriate Content
- Mark as New
- Bookmark
- Subscribe
- Mute
- Subscribe to RSS Feed
- Permalink
- Report Inappropriate Content
Try this:
Max(AGGR(SUM(ord_totalmiles),payperiod))*1.2
- Mark as New
- Bookmark
- Subscribe
- Mute
- Subscribe to RSS Feed
- Permalink
- Report Inappropriate Content
Thanks Dan! This was my final solution:
Max({<InPayWindow={1}>}AGGR(SUM(ord_totalmiles),pyh_payperiod))
In layman's terms, I'm saying , Find the SUM(ord_totalmiles) GROUP BY pyh_payperid. Take the max of that list/table provided that the InPayWindow = 1.
My chart now looks like this.