Unlock a world of possibilities! Login now and discover the exclusive benefits awaiting you.
- Qlik Community
- :
- Forums
- :
- Analytics
- :
- New to Qlik Analytics
- :
- Roll up data - min, avg and max values
- Subscribe to RSS Feed
- Mark Topic as New
- Mark Topic as Read
- Float this Topic for Current User
- Bookmark
- Subscribe
- Mute
- Printer Friendly Page
- Mark as New
- Bookmark
- Subscribe
- Mute
- Subscribe to RSS Feed
- Permalink
- Report Inappropriate Content
Roll up data - min, avg and max values
Hi All,
I am currently working on quotes. When we request for quotes, we get multiple responses/amounts and I am just trying to tie in the min, avg and max amounts to that quote request by rolling up the data.
The data model currently looks like below.
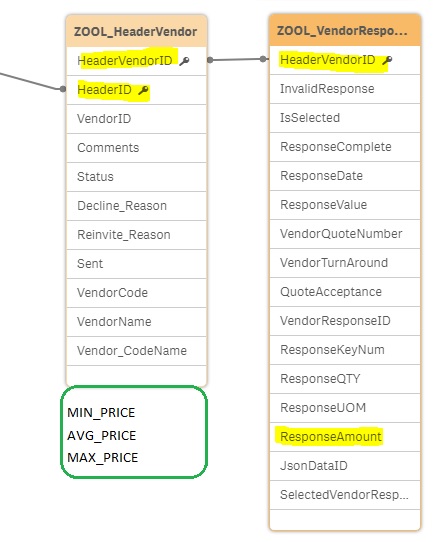
The green box is my goal where the MIN_PRICE, AVG_PRICE and MAX_PRICE should be derived by getting the MIN, AVG, and MAX of (ResponseAmount).
I wanted these 3 data rolled up because I am having difficulties when doing pivot tables and charts over a time dimension.
Any suggestions, solutions, etc?
Appreciate any help..thanks!
Accepted Solutions
- Mark as New
- Bookmark
- Subscribe
- Mute
- Subscribe to RSS Feed
- Permalink
- Report Inappropriate Content
The short answer is: Sum(Aggr(Avg(ResponseAmount),Year,HeaderID))
A more elaborate explanation follows - showing a more flexible technique by using RowNo() and if necessary ColumnNo() (if you pivot out something as additional columns)...
You can make an extra check to determine if you are on a TOTALS row in your Pivot Table. That leaves you with full flexibility into putting any type of calculation instead of the "granular"/normal calculation for the totals in your pivot table.
This shows which built-in functions that can be used to determine this and how you can employ them in an expression to calculate exactly what you want at the totals rows:
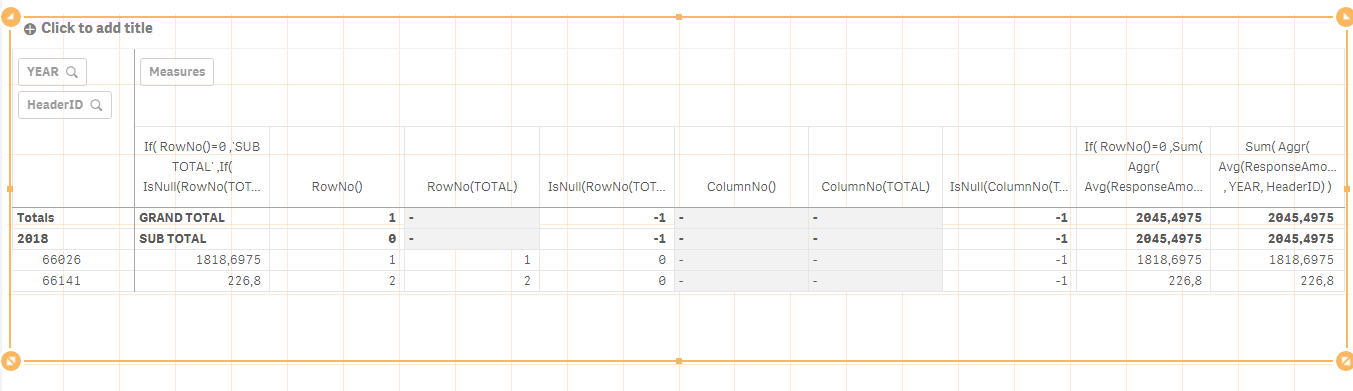
The first Measures column just shows how the logic works. The next 6 columns shows what RowNo() and ColumnNo() returns so you can use them in an expression to calculate the right measure. Either of the last two columns is what you are aiming at. Why did I include the eigth column at all? The ninth does the job and is simpler. In other cases the same calculation won't do for all the levels and then the eight columns expression shows how to make a completely different calculation for the totals....
So columns 1 to 7 of the measures can be deleted and just keep the either of the last two for your final table - the expression for that is:
If(RowNo()=0 OR IsNull(RowNo(TOTAL)),Sum(Aggr(Avg(ResponseAmount),YEAR,HeaderID)),Avg(ResponseAmount))
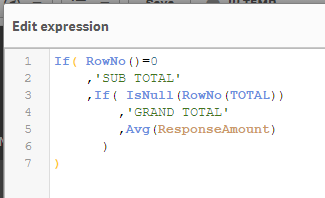
FYI the first column in Measures looks like this:
- Mark as New
- Bookmark
- Subscribe
- Mute
- Subscribe to RSS Feed
- Permalink
- Report Inappropriate Content
Hi Jessie,
Please find the attached app I hope it helps with your problem as I might not fully understand your problem
Kind Regards
Sibusiso Phumelo sibusiso90
- Mark as New
- Bookmark
- Subscribe
- Mute
- Subscribe to RSS Feed
- Permalink
- Report Inappropriate Content
It is a hard for me to understand exactly what your difficulties are. Doesn't Min(ResponseAmount) and so forth work for you?
What does HeaderID identify really? What does the HeaderVendorID identify? Is it purely the Vendor as such or a combination of a unique Header AND a Vendor? What is the relationship between HeaderID and HeaderVendorID - is it one-to-many or many-to-many?
- Mark as New
- Bookmark
- Subscribe
- Mute
- Subscribe to RSS Feed
- Permalink
- Report Inappropriate Content
Hi Petter,
Yeah, I think my issue wasn't too clear.
So I will start with the data:
| YEAR | HeaderID | HeaderVendorID | ResponseAmount |
| 2018 | 66026 | 133813 | $2,082.00 |
| 2018 | 66026 | 133815 | $1,170.00 |
| 2018 | 66026 | 133820 | $2,276.40 |
| 2018 | 66026 | 133822 | $1,620.00 |
| 2018 | 66026 | 133827 | $1,963.00 |
| 2018 | 66026 | 133828 | $1,174.00 |
| 2018 | 66026 | 133832 | $1,387.00 |
| 2018 | 66026 | 133837 | $1,722.00 |
| 2018 | 66026 | 133845 | $1,795.00 |
| 2018 | 66026 | 133846 | $2,208.97 |
| 2018 | 66026 | 133847 | $2,026.00 |
| 2018 | 66026 | 133848 | $2,400.00 |
| 2018 | 66141 | 134675 | $235.20 |
| 2018 | 66141 | 134678 | $218.40 |
MIN(ResponseAmount), AVG(ResponseAmount), and MAX(ResponseAmount) are OK if I do a pivot table on HeaderID which is displayed below:
| HeaderID | MIN_PRICE | AVG_PRICE | MAX_PRICE |
| 66026 | $1,170.00 | $1,818.70 | $2,400.00 |
| 66141 | $218.40 | $226.80 | $235.20 |
My aim is to have a SUM of all the MIN prices for the YEAR, Same goes to AVG and MAX. But I end up getting below which is still getting the MIN among the amount and not the SUM of all the minimum amounts.
What I am getting:
| YEAR | MIN_PRICE | AVG_PRICE | MAX_PRICE |
| 2018 | $218.40 | $1,591.28 | $2,400.00 |
Even I put in the totals, I still get this:
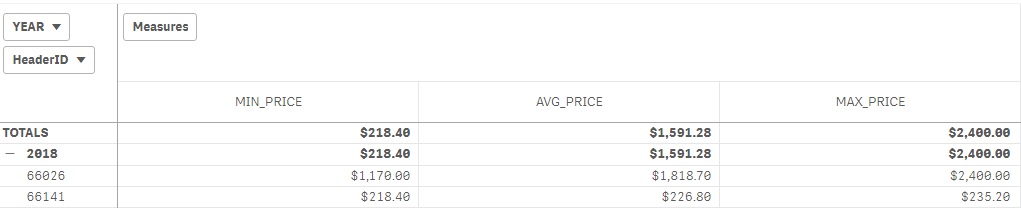
This is what I want to achieve:
| YEAR | MIN_PRICE | AVG_PRICE | MAX_PRICE |
| 2018 | $1,388.40 | $2,045.50 | $2,635.20 |
I hope this is clearer now and hopefully there is a simpler solution to achieve this.
Thanks!
- Mark as New
- Bookmark
- Subscribe
- Mute
- Subscribe to RSS Feed
- Permalink
- Report Inappropriate Content
Hi Sib,
Sorry, can't see the attachment.
But please see my reply to Petter.
Hope that helps in understanding my issue.
Thanks!
- Mark as New
- Bookmark
- Subscribe
- Mute
- Subscribe to RSS Feed
- Permalink
- Report Inappropriate Content
Hi
May be your mesure need and Agrr() function in your pivot table
Try this
MIN_PRICE
min(Aggr(ResponseAmount,HeaderID,Year))
AVG_PRICE
avg(Aggr(ResponseAmount,HeaderID,Year))
MAX_PRICE
MAX(Aggr(ResponseAmount,HeaderID,Year))
- Mark as New
- Bookmark
- Subscribe
- Mute
- Subscribe to RSS Feed
- Permalink
- Report Inappropriate Content
The short answer is: Sum(Aggr(Avg(ResponseAmount),Year,HeaderID))
A more elaborate explanation follows - showing a more flexible technique by using RowNo() and if necessary ColumnNo() (if you pivot out something as additional columns)...
You can make an extra check to determine if you are on a TOTALS row in your Pivot Table. That leaves you with full flexibility into putting any type of calculation instead of the "granular"/normal calculation for the totals in your pivot table.
This shows which built-in functions that can be used to determine this and how you can employ them in an expression to calculate exactly what you want at the totals rows:
The first Measures column just shows how the logic works. The next 6 columns shows what RowNo() and ColumnNo() returns so you can use them in an expression to calculate the right measure. Either of the last two columns is what you are aiming at. Why did I include the eigth column at all? The ninth does the job and is simpler. In other cases the same calculation won't do for all the levels and then the eight columns expression shows how to make a completely different calculation for the totals....
So columns 1 to 7 of the measures can be deleted and just keep the either of the last two for your final table - the expression for that is:
If(RowNo()=0 OR IsNull(RowNo(TOTAL)),Sum(Aggr(Avg(ResponseAmount),YEAR,HeaderID)),Avg(ResponseAmount))
FYI the first column in Measures looks like this:
- Mark as New
- Bookmark
- Subscribe
- Mute
- Subscribe to RSS Feed
- Permalink
- Report Inappropriate Content
It worked! Thanks a lot!