Unlock a world of possibilities! Login now and discover the exclusive benefits awaiting you.
- Qlik Community
- :
- Forums
- :
- Analytics
- :
- New to Qlik Analytics
- :
- Re: Roll up to 1st date
- Subscribe to RSS Feed
- Mark Topic as New
- Mark Topic as Read
- Float this Topic for Current User
- Bookmark
- Subscribe
- Mute
- Printer Friendly Page
- Mark as New
- Bookmark
- Subscribe
- Mute
- Subscribe to RSS Feed
- Permalink
- Report Inappropriate Content
Roll up to 1st date
Hi,
| Date | Col A | Col B | Col C | MTD |
| 01-01-2017 | 5 | 2 | 2 | 125% |
| 02-01-2017 | 3 | 5 | 4 | 73% |
03-01-2017 | 4 | 4 | 2 | 85% |
In the above table the MTD column logic for 01-01-2017 is : Col A /( Col B + Col C) i.e 5 / (2+2)
Logic for 02-01-2017 is : sum(Col A) / (sum(Col B) + Col C) i.e (5+3) / ( (2+5) + 4) and this roll up continues for the rest of the dates. Also the roll up should be restricted to the 1st of every month.
Can someone please tell me the set analysis to achieve the same in the front end? 
- Mark as New
- Bookmark
- Subscribe
- Mute
- Subscribe to RSS Feed
- Permalink
- Report Inappropriate Content
May be like this
RangeSum(Above(Sum(ColA), 0, RowNo())) / (RangeSum(Above(Sum(ColB), 0, RowNo())) + Sum(ColC))
- Mark as New
- Bookmark
- Subscribe
- Mute
- Subscribe to RSS Feed
- Permalink
- Report Inappropriate Content
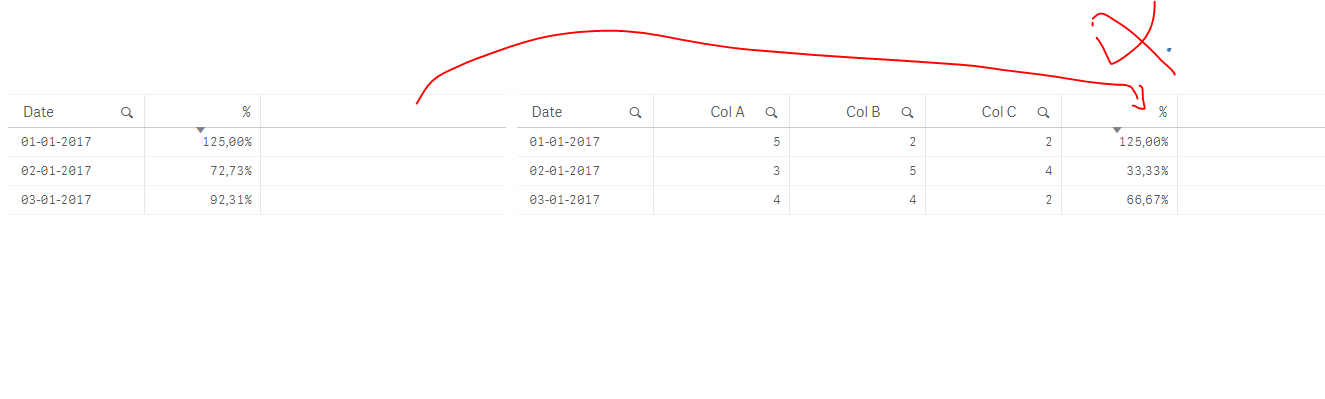
If you want to have in a table :
RangeSum(Above(Sum({<date>}[Col A]), 0, RowNo())) / (RangeSum(Above(Sum({<date>}[Col B]), 0, RowNo())) + Sum({<date>}[Col C]))
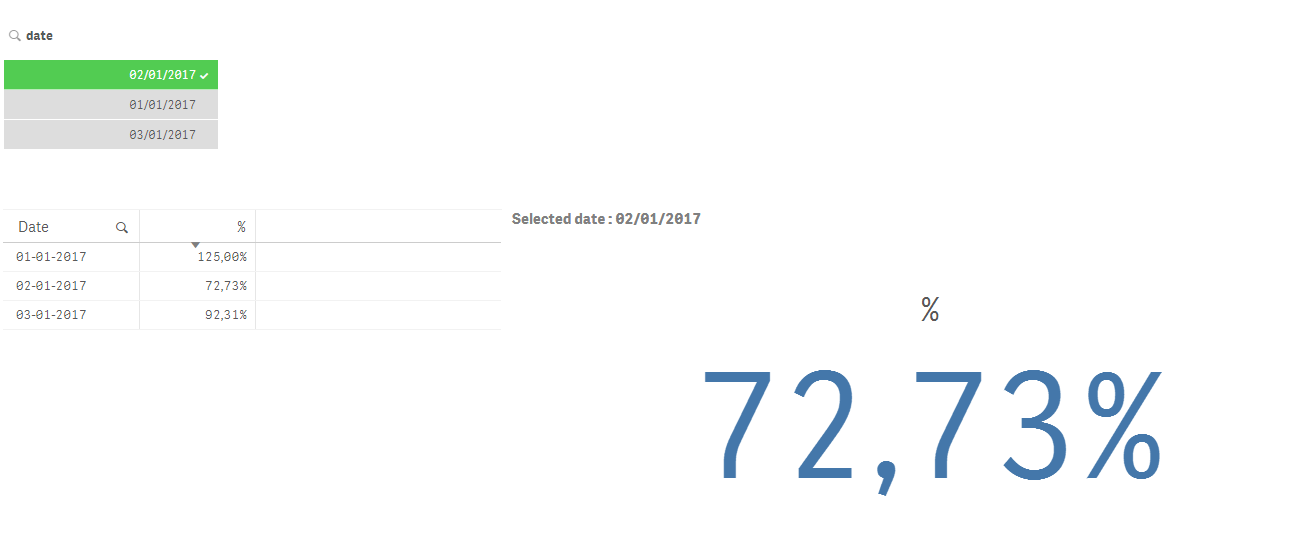
If you want to have a KPI object, and when you select a date, you have your calculation:
sum({<date=, date={">=$(=MonthStart(Max(date)))<=$(=Max(date))"}>}[Col A])
/(sum({<date=, date={">=$(=MonthStart(Max(date)))<=$(=Max(date))"}>}[Col B])
+
aggr(sum([Col C]),date))
Result:
- Mark as New
- Bookmark
- Subscribe
- Mute
- Subscribe to RSS Feed
- Permalink
- Report Inappropriate Content
Hi sunny, what If I wanted to add Col A, Col B and Col C as dimensions in the table?
That would affect the output, how should we change the expression in this case?
- Mark as New
- Bookmark
- Subscribe
- Mute
- Subscribe to RSS Feed
- Permalink
- Report Inappropriate Content
In that case you need a total
RangeSum(Above(TOTAL Sum(ColA), 0, RowNo(TOTAL))) / (RangeSum(Above(TOTAL Sum(ColB), 0, RowNo(TOTAL))) + Sum(ColC))