Unlock a world of possibilities! Login now and discover the exclusive benefits awaiting you.
- Qlik Community
- :
- Forums
- :
- Analytics
- :
- New to Qlik Analytics
- :
- Re: Sankey chart does NOT render. 🤔
- Subscribe to RSS Feed
- Mark Topic as New
- Mark Topic as Read
- Float this Topic for Current User
- Bookmark
- Subscribe
- Mute
- Printer Friendly Page
- Mark as New
- Bookmark
- Subscribe
- Mute
- Subscribe to RSS Feed
- Permalink
- Report Inappropriate Content
Sankey chart does NOT render. 🤔
Has anyone faced the same rendering issue with the Sankey Chart? How can I solve it?
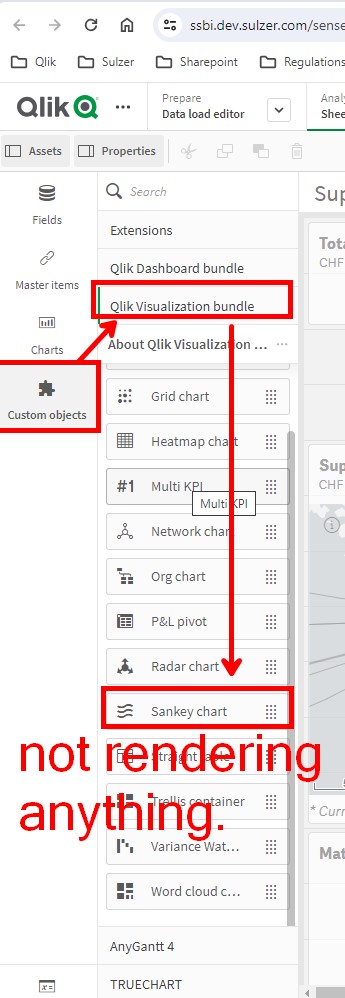
Hi everybody! It seems like the Sankey chart at Qlik Sense does not render properly. It shows blank. 🤔🤔🤔
I was trying to do this example but I couldn't get it to work.
Thanks a lot!
- Mark as New
- Bookmark
- Subscribe
- Mute
- Subscribe to RSS Feed
- Permalink
- Report Inappropriate Content
What do you mean by "not rendering anything"? Can you post a screenshot of that? Have you tried displaying your data in a straight table to see if there is something to display? If so, could you post a snippet of your data as a CSV or Excel so it would be possible to recreate your situation?
- Mark as New
- Bookmark
- Subscribe
- Mute
- Subscribe to RSS Feed
- Permalink
- Report Inappropriate Content
Hi Steefan!
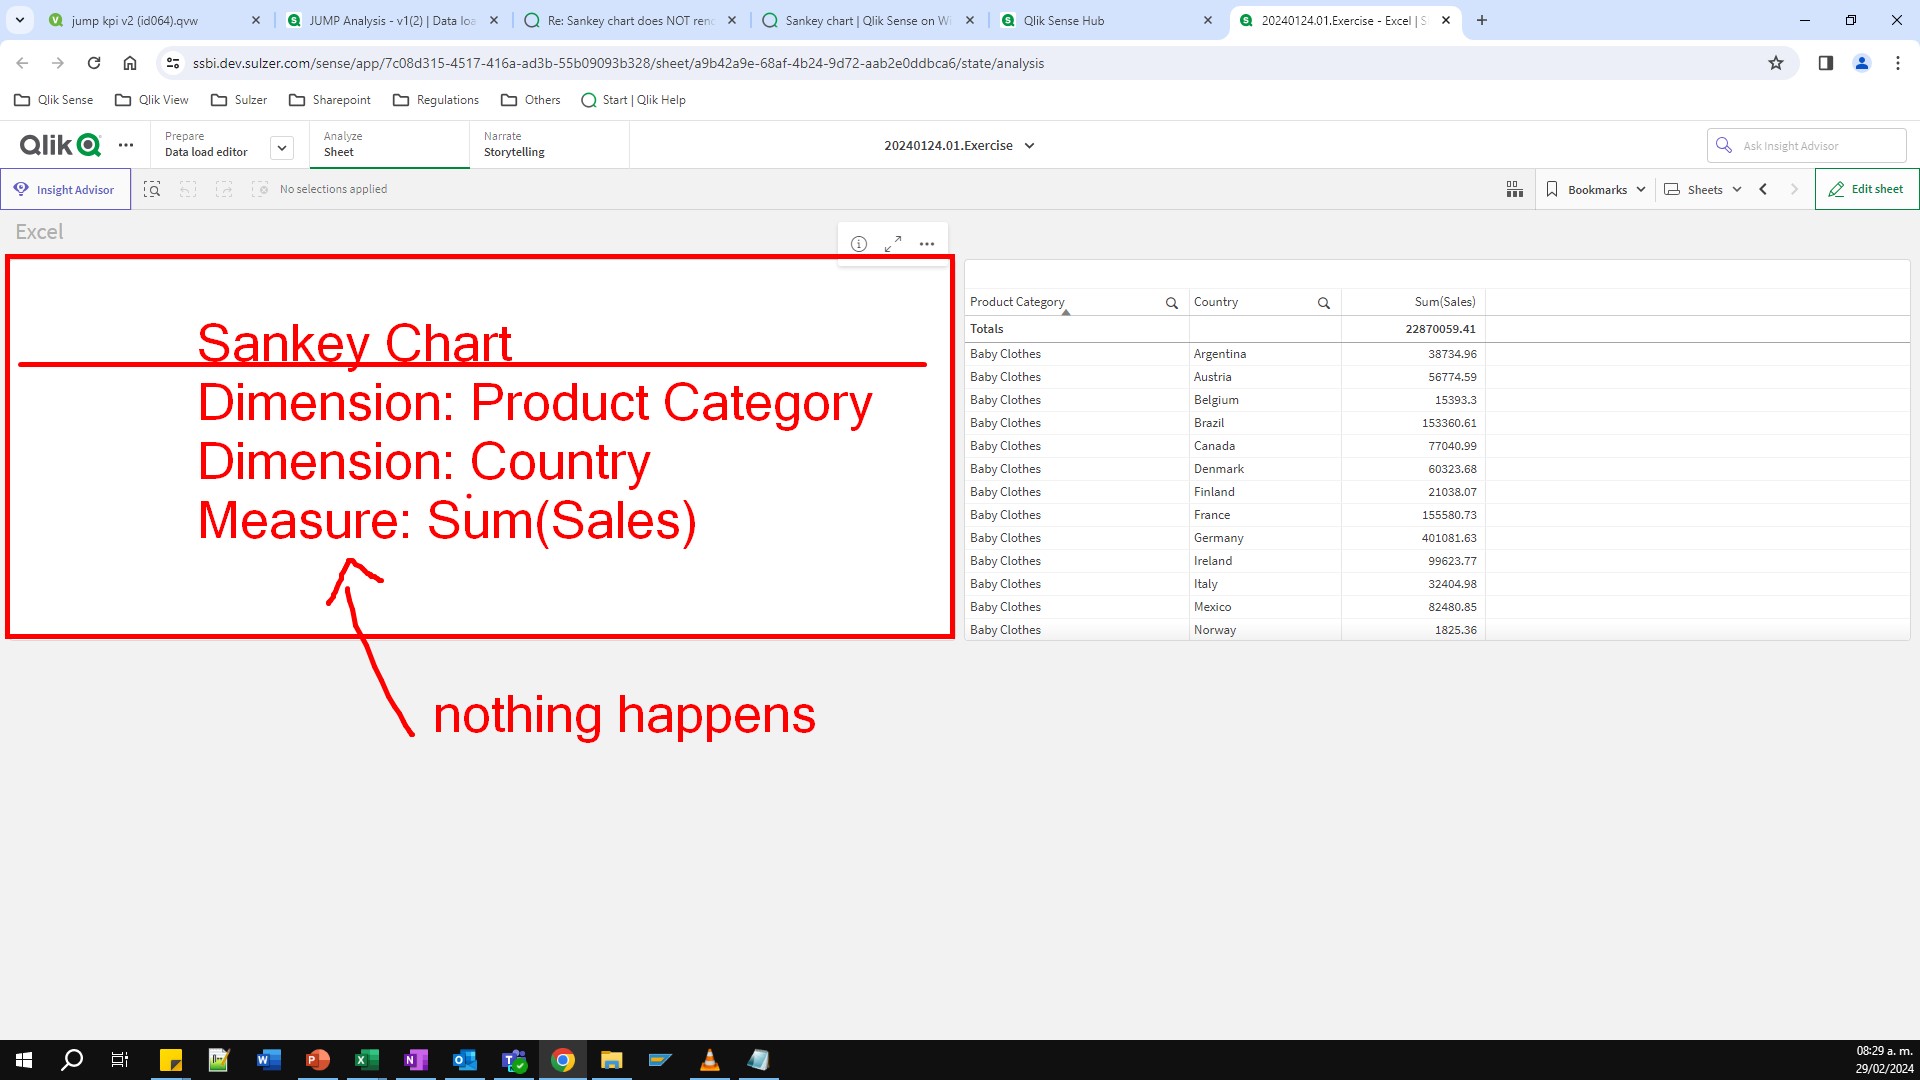
Thanks for your reply. Yes, nothing happens. It appears blank. Here is the screenshot.
There is the Sankey chart and a table both configured with 2 dimensions (PRODUCT CATEGORY + COUNTRY) and 1 measure (SUM(SALES)).
I think it is useful to say that it used to work anytime in the past but today it's not rendering. My colleague inherited some of his project files and it used to work the year before, but today it's not rendering.
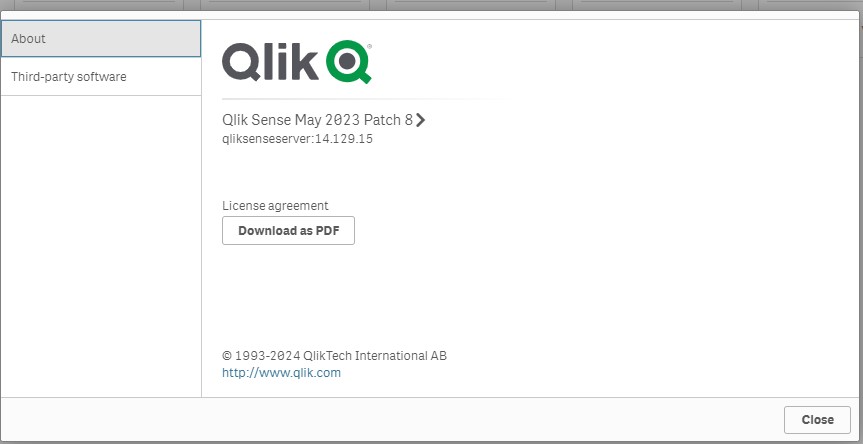
We are using Qlik Sense for Windows Enterprise.
Qlik Sense May 2023 Patch 8.
qliksenseserver 14.129.15
- Mark as New
- Bookmark
- Subscribe
- Mute
- Subscribe to RSS Feed
- Permalink
- Report Inappropriate Content
No clue - works for me on Nov 2023 Patch 3:

Have you tried getting rid of the spaces in your field names? That's the only thing I can think of right now.
- Mark as New
- Bookmark
- Subscribe
- Mute
- Subscribe to RSS Feed
- Permalink
- Report Inappropriate Content
Hi!
Thanks for your help!
There was a bug in our development environment which was preventing the correct rendering. It has already been solved.
Now, it's rendering correctly.
Thanks! Have a great day. 🙌😃